

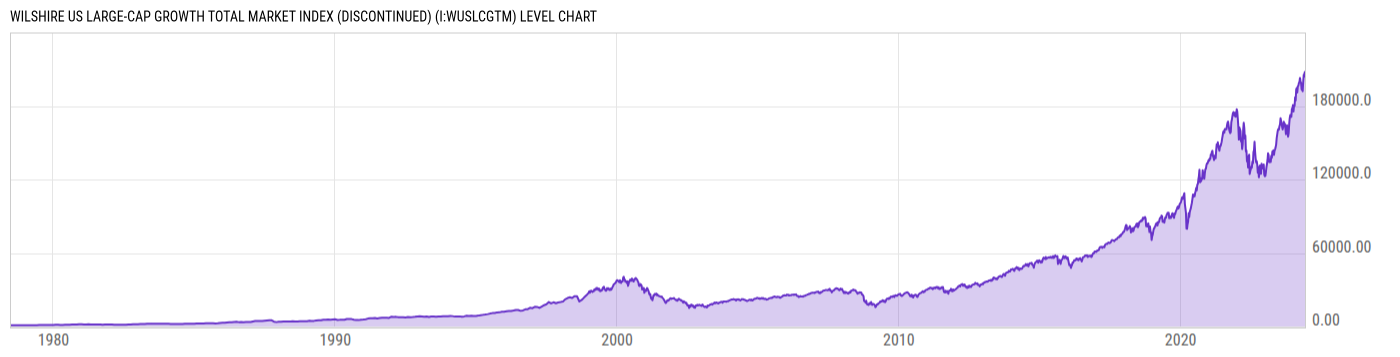
Wilshire US Large-Cap Growth Total Market Index (DISCONTINUED) (I:WUSLCGTM)
204088.7 USD for May 31 2024
Level Chart
Basic Info
|
Wilshire US Large-Cap Growth Total Market Index is at a current level of 204088.7, up from 203708.8 the previous market day and up from 154832.7 one year ago. This is a change of 0.19% from the previous market day and 31.81% from one year ago. |
| Report | Wilshire Indexes |
| Category | Market Indices and Statistics |
| Region | United States |
| Source | Wilshire |
Stats
| Last Value | 204088.7 |
| Latest Period | May 31 2024 |
| Last Updated | Jun 3 2024, 08:12 EDT |
| Average Growth Rate | 23.67% |
| Value from The Previous Market Day | 203708.8 |
| Change from The Previous Market Day | 0.19% |
| Value from 1 Year Ago | 154832.7 |
| Change from 1 Year Ago | 31.81% |
| Frequency | Market Daily |
| Unit | USD |
| Adjustment | N/A |
Historical Data
| Date | Value |
|---|---|
| May 31, 2024 | 204088.7 |
| May 30, 2024 | 203708.8 |
| May 28, 2024 | 207671.5 |
| May 24, 2024 | 206712.1 |
| May 23, 2024 | 205029.1 |
| May 22, 2024 | 205703.0 |
| May 21, 2024 | 206384.7 |
| May 17, 2024 | 204771.8 |
| May 16, 2024 | 204647.8 |
| May 15, 2024 | 205570.3 |
| May 14, 2024 | 202256.8 |
| May 13, 2024 | 200933.1 |
| May 10, 2024 | 200945.6 |
| May 09, 2024 | 200755.1 |
| May 08, 2024 | 200167.4 |
| May 07, 2024 | 200567.1 |
| May 06, 2024 | 200592.5 |
| May 03, 2024 | 197863.6 |
| May 02, 2024 | 194561.4 |
| May 01, 2024 | 192058.0 |
| April 30, 2024 | 192667.3 |
| April 29, 2024 | 196249.7 |
| April 26, 2024 | 195970.9 |
| April 25, 2024 | 192339.4 |
| April 24, 2024 | 193345.2 |
| Date | Value |
|---|---|
| April 23, 2024 | 193545.1 |
| April 22, 2024 | 190598.5 |
| April 19, 2024 | 188849.4 |
| April 18, 2024 | 192686.4 |
| April 17, 2024 | 193514.3 |
| April 16, 2024 | 195352.3 |
| April 15, 2024 | 195349.8 |
| April 12, 2024 | 198873.6 |
| April 11, 2024 | 201715.8 |
| April 10, 2024 | 198924.2 |
| April 09, 2024 | 200402.3 |
| April 08, 2024 | 200237.0 |
| April 05, 2024 | 200307.8 |
| April 04, 2024 | 197468.7 |
| April 03, 2024 | 200239.8 |
| April 02, 2024 | 199609.1 |
| April 01, 2024 | 201463.7 |
| March 28, 2024 | 201498.3 |
| March 27, 2024 | 202900.1 |
| March 26, 2024 | 201940.8 |
| March 25, 2024 | 202962.7 |
| March 22, 2024 | 201583.2 |
| March 21, 2024 | 202165.5 |
| March 20, 2024 | 199469.9 |
| March 19, 2024 | 196124.7 |
News
Headline
Time (ET)
Basic Info
|
Wilshire US Large-Cap Growth Total Market Index is at a current level of 204088.7, up from 203708.8 the previous market day and up from 154832.7 one year ago. This is a change of 0.19% from the previous market day and 31.81% from one year ago. |
| Report | Wilshire Indexes |
| Category | Market Indices and Statistics |
| Region | United States |
| Source | Wilshire |
Stats
| Last Value | 204088.7 |
| Latest Period | May 31 2024 |
| Last Updated | Jun 3 2024, 08:12 EDT |
| Average Growth Rate | 23.67% |
| Value from The Previous Market Day | 203708.8 |
| Change from The Previous Market Day | 0.19% |
| Value from 1 Year Ago | 154832.7 |
| Change from 1 Year Ago | 31.81% |
| Frequency | Market Daily |
| Unit | USD |
| Adjustment | N/A |