

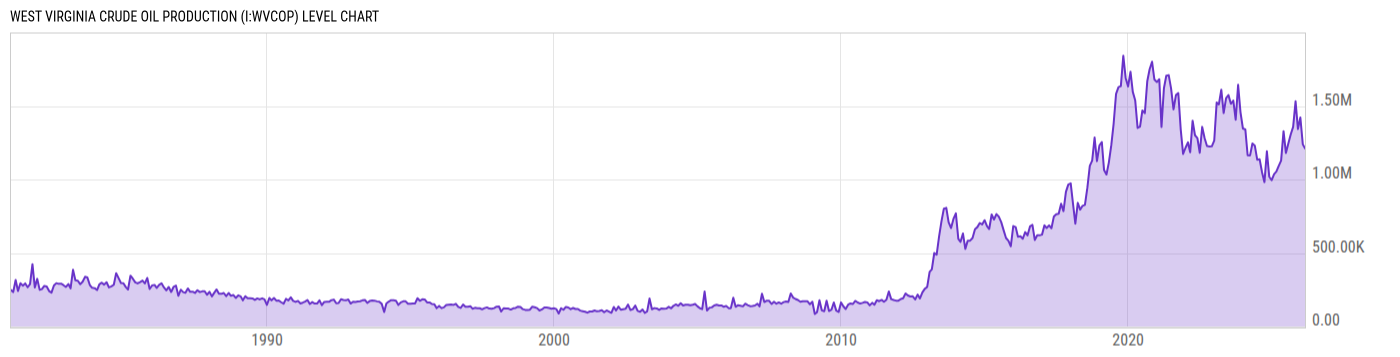
West Virginia Crude Oil Production (I:WVCOP)
1.212M bbl for Feb 2026
Level Chart
Basic Info
|
West Virginia Crude Oil Production is at a current level of 1.212M, down from 1.239M last month and up from 1.053M one year ago. This is a change of -2.18% from last month and 15.10% from one year ago. |
| Report | Crude Oil Production |
| Category | Energy |
| Region | West Virginia |
| Source | Energy Information Administration |
Stats
| Last Value | 1.212M |
| Latest Period | Feb 2026 |
| Last Updated | Apr 30 2026, 15:34 EDT |
| Next Release | May 29 2026, 15:30 EDT |
| Average Growth Rate | 16.09% |
| Value from Last Month | 1.239M |
| Change from Last Month | -2.18% |
| Value from 1 Year Ago | 1.053M |
| Change from 1 Year Ago | 15.10% |
| Frequency | Monthly |
| Unit | Barrels |
| Adjustment | N/A |
| Download Source File |
Historical Data
| Date | Value |
|---|---|
| February 28, 2026 | 1.212M |
| January 31, 2026 | 1.239M |
| December 31, 2025 | 1.422M |
| November 30, 2025 | 1.343M |
| October 31, 2025 | 1.532M |
| September 30, 2025 | 1.358M |
| August 31, 2025 | 1.308M |
| July 31, 2025 | 1.245M |
| June 30, 2025 | 1.181M |
| May 31, 2025 | 1.329M |
| April 30, 2025 | 1.128M |
| March 31, 2025 | 1.093M |
| February 28, 2025 | 1.053M |
| January 31, 2025 | 1.036M |
| December 31, 2024 | 995.00K |
| November 30, 2024 | 1.019M |
| October 31, 2024 | 1.192M |
| September 30, 2024 | 982.00K |
| August 31, 2024 | 1.048M |
| July 31, 2024 | 1.137M |
| June 30, 2024 | 1.135M |
| May 31, 2024 | 1.229M |
| April 30, 2024 | 1.245M |
| March 31, 2024 | 1.164M |
| February 29, 2024 | 1.165M |
| Date | Value |
|---|---|
| January 31, 2024 | 1.34M |
| December 31, 2023 | 1.347M |
| November 30, 2023 | 1.459M |
| October 31, 2023 | 1.644M |
| September 30, 2023 | 1.407M |
| August 31, 2023 | 1.537M |
| July 31, 2023 | 1.515M |
| June 30, 2023 | 1.574M |
| May 31, 2023 | 1.553M |
| April 30, 2023 | 1.452M |
| March 31, 2023 | 1.611M |
| February 28, 2023 | 1.511M |
| January 31, 2023 | 1.523M |
| December 31, 2022 | 1.264M |
| November 30, 2022 | 1.226M |
| October 31, 2022 | 1.225M |
| September 30, 2022 | 1.228M |
| August 31, 2022 | 1.281M |
| July 31, 2022 | 1.358M |
| June 30, 2022 | 1.182M |
| May 31, 2022 | 1.282M |
| April 30, 2022 | 1.301M |
| March 31, 2022 | 1.40M |
| February 28, 2022 | 1.185M |
| January 31, 2022 | 1.253M |
News
Headline
Time (ET)
05/13 14:39
05/06 06:06
05/05 05:55
Basic Info
|
West Virginia Crude Oil Production is at a current level of 1.212M, down from 1.239M last month and up from 1.053M one year ago. This is a change of -2.18% from last month and 15.10% from one year ago. |
| Report | Crude Oil Production |
| Category | Energy |
| Region | West Virginia |
| Source | Energy Information Administration |
Stats
| Last Value | 1.212M |
| Latest Period | Feb 2026 |
| Last Updated | Apr 30 2026, 15:34 EDT |
| Next Release | May 29 2026, 15:30 EDT |
| Average Growth Rate | 16.09% |
| Value from Last Month | 1.239M |
| Change from Last Month | -2.18% |
| Value from 1 Year Ago | 1.053M |
| Change from 1 Year Ago | 15.10% |
| Frequency | Monthly |
| Unit | Barrels |
| Adjustment | N/A |
| Download Source File |