

West South Central Census Division House Price Index (I:WSCCDHSM)
422.34 for Mar 2026
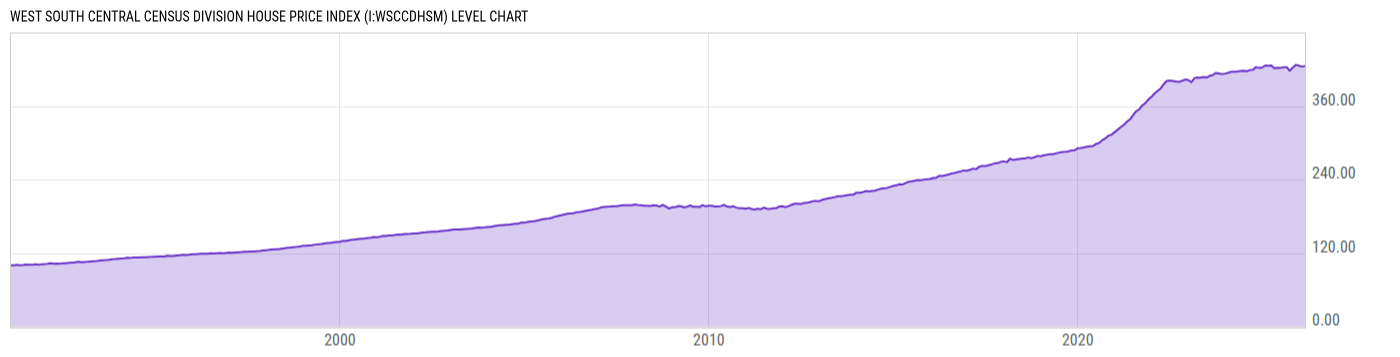
Level Chart
Basic Info
|
West South Central Census Division House Price Index is at a current level of 422.34, down from 424.30 last month and down from 426.32 one year ago. This is a change of -0.46% from last month and -0.93% from one year ago. |
| Report | FHFA House Price Index |
| Category | House Prices |
| Region | United States |
| Source | Federal Housing Finance Agency |
Stats
| Last Value | 422.34 |
| Latest Period | Mar 2026 |
| Last Updated | May 26 2026, 09:02 EDT |
| Next Release | Jun 30 2026, 09:00 EDT |
| Average Growth Rate | 4.12% |
| Value from Last Month | 424.30 |
| Change from Last Month | -0.46% |
| Value from 1 Year Ago | 426.32 |
| Change from 1 Year Ago | -0.93% |
| Frequency | Monthly |
| Unit | Index January 1991=100 |
| Adjustment | Seasonally Adjusted |
| Download Source File |
Historical Data
| Date | Value |
|---|---|
| March 31, 2026 | 422.34 |
| February 28, 2026 | 424.30 |
| January 31, 2026 | 424.69 |
| December 31, 2025 | 426.22 |
| November 30, 2025 | 427.05 |
| October 31, 2025 | 422.98 |
| September 30, 2025 | 417.47 |
| August 31, 2025 | 423.20 |
| July 31, 2025 | 423.07 |
| June 30, 2025 | 422.17 |
| May 31, 2025 | 422.26 |
| April 30, 2025 | 421.72 |
| March 31, 2025 | 426.32 |
| February 28, 2025 | 425.24 |
| January 31, 2025 | 425.48 |
| December 31, 2024 | 422.81 |
| November 30, 2024 | 421.97 |
| October 31, 2024 | 423.31 |
| September 30, 2024 | 419.13 |
| August 31, 2024 | 418.63 |
| July 31, 2024 | 416.61 |
| June 30, 2024 | 417.22 |
| May 31, 2024 | 416.99 |
| April 30, 2024 | 416.35 |
| March 31, 2024 | 415.84 |
| Date | Value |
|---|---|
| February 29, 2024 | 415.86 |
| January 31, 2024 | 414.39 |
| December 31, 2023 | 412.86 |
| November 30, 2023 | 412.05 |
| October 31, 2023 | 412.94 |
| September 30, 2023 | 413.96 |
| August 31, 2023 | 410.65 |
| July 31, 2023 | 409.29 |
| June 30, 2023 | 406.45 |
| May 31, 2023 | 407.48 |
| April 30, 2023 | 406.11 |
| March 31, 2023 | 406.37 |
| February 28, 2023 | 405.36 |
| January 31, 2023 | 398.78 |
| December 31, 2022 | 402.43 |
| November 30, 2022 | 403.10 |
| October 31, 2022 | 401.25 |
| September 30, 2022 | 399.35 |
| August 31, 2022 | 399.93 |
| July 31, 2022 | 400.98 |
| June 30, 2022 | 401.72 |
| May 31, 2022 | 400.92 |
| April 30, 2022 | 395.54 |
| March 31, 2022 | 388.30 |
| February 28, 2022 | 384.54 |
News
Headline
Time (ET)
06/03 07:13
05/28 12:00
05/15 07:05
05/14 12:00
05/14 07:24
05/07 12:00
Basic Info
|
West South Central Census Division House Price Index is at a current level of 422.34, down from 424.30 last month and down from 426.32 one year ago. This is a change of -0.46% from last month and -0.93% from one year ago. |
| Report | FHFA House Price Index |
| Category | House Prices |
| Region | United States |
| Source | Federal Housing Finance Agency |
Stats
| Last Value | 422.34 |
| Latest Period | Mar 2026 |
| Last Updated | May 26 2026, 09:02 EDT |
| Next Release | Jun 30 2026, 09:00 EDT |
| Average Growth Rate | 4.12% |
| Value from Last Month | 424.30 |
| Change from Last Month | -0.46% |
| Value from 1 Year Ago | 426.32 |
| Change from 1 Year Ago | -0.93% |
| Frequency | Monthly |
| Unit | Index January 1991=100 |
| Adjustment | Seasonally Adjusted |
| Download Source File |