

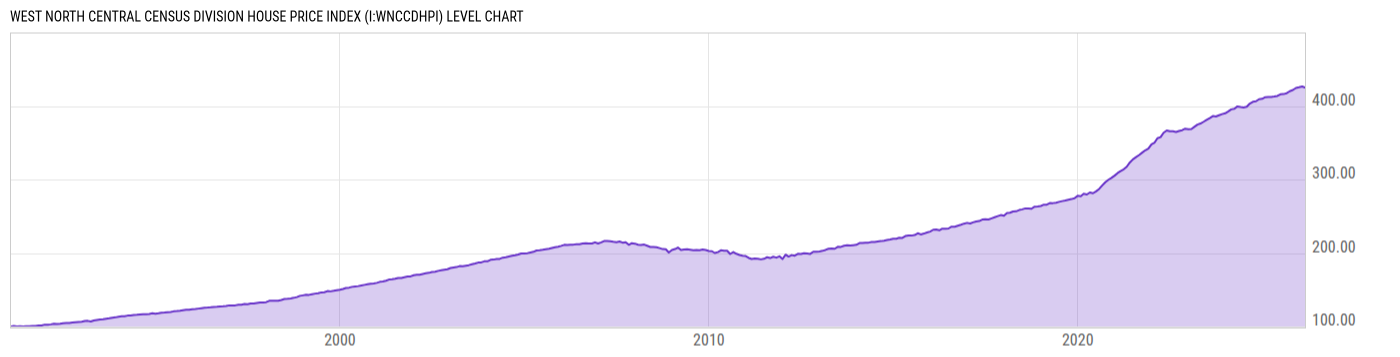
West North Central Census Division House Price Index (I:WNCCDHPI)
425.78 for Mar 2026
Level Chart
Basic Info
|
West North Central Census Division House Price Index is at a current level of 425.78, up from 424.69 last month and up from 412.27 one year ago. This is a change of 0.26% from last month and 3.28% from one year ago. |
| Report | FHFA House Price Index |
| Category | House Prices |
| Region | United States |
| Source | Federal Housing Finance Agency |
Stats
| Last Value | 425.78 |
| Latest Period | Mar 2026 |
| Last Updated | May 26 2026, 09:02 EDT |
| Next Release | Jun 30 2026, 09:00 EDT |
| Average Growth Rate | 4.15% |
| Value from Last Month | 424.69 |
| Change from Last Month | 0.26% |
| Value from 1 Year Ago | 412.27 |
| Change from 1 Year Ago | 3.28% |
| Frequency | Monthly |
| Unit | Index January 1991=100 |
| Adjustment | Seasonally Adjusted |
| Download Source File |
Historical Data
| Date | Value |
|---|---|
| March 31, 2026 | 425.78 |
| February 28, 2026 | 424.69 |
| January 31, 2026 | 426.89 |
| December 31, 2025 | 425.25 |
| November 30, 2025 | 424.10 |
| October 31, 2025 | 421.64 |
| September 30, 2025 | 419.82 |
| August 31, 2025 | 417.26 |
| July 31, 2025 | 416.00 |
| June 30, 2025 | 415.75 |
| May 31, 2025 | 413.66 |
| April 30, 2025 | 412.77 |
| March 31, 2025 | 412.27 |
| February 28, 2025 | 411.58 |
| January 31, 2025 | 412.01 |
| December 31, 2024 | 409.44 |
| November 30, 2024 | 409.02 |
| October 31, 2024 | 406.20 |
| September 30, 2024 | 405.50 |
| August 31, 2024 | 403.18 |
| July 31, 2024 | 398.71 |
| June 30, 2024 | 397.85 |
| May 31, 2024 | 398.45 |
| April 30, 2024 | 399.49 |
| March 31, 2024 | 395.91 |
| Date | Value |
|---|---|
| February 29, 2024 | 395.42 |
| January 31, 2024 | 392.71 |
| December 31, 2023 | 390.09 |
| November 30, 2023 | 388.94 |
| October 31, 2023 | 387.39 |
| September 30, 2023 | 385.65 |
| August 31, 2023 | 386.27 |
| July 31, 2023 | 383.56 |
| June 30, 2023 | 381.15 |
| May 31, 2023 | 378.57 |
| April 30, 2023 | 376.14 |
| March 31, 2023 | 374.69 |
| February 28, 2023 | 371.61 |
| January 31, 2023 | 368.79 |
| December 31, 2022 | 368.34 |
| November 30, 2022 | 369.10 |
| October 31, 2022 | 367.12 |
| September 30, 2022 | 366.08 |
| August 31, 2022 | 364.70 |
| July 31, 2022 | 365.55 |
| June 30, 2022 | 365.54 |
| May 31, 2022 | 366.69 |
| April 30, 2022 | 363.61 |
| March 31, 2022 | 357.67 |
| February 28, 2022 | 356.17 |
News
Headline
Time (ET)
06/03 07:13
05/28 12:00
05/15 07:05
05/14 12:00
05/14 07:24
05/07 12:00
Basic Info
|
West North Central Census Division House Price Index is at a current level of 425.78, up from 424.69 last month and up from 412.27 one year ago. This is a change of 0.26% from last month and 3.28% from one year ago. |
| Report | FHFA House Price Index |
| Category | House Prices |
| Region | United States |
| Source | Federal Housing Finance Agency |
Stats
| Last Value | 425.78 |
| Latest Period | Mar 2026 |
| Last Updated | May 26 2026, 09:02 EDT |
| Next Release | Jun 30 2026, 09:00 EDT |
| Average Growth Rate | 4.15% |
| Value from Last Month | 424.69 |
| Change from Last Month | 0.26% |
| Value from 1 Year Ago | 412.27 |
| Change from 1 Year Ago | 3.28% |
| Frequency | Monthly |
| Unit | Index January 1991=100 |
| Adjustment | Seasonally Adjusted |
| Download Source File |