

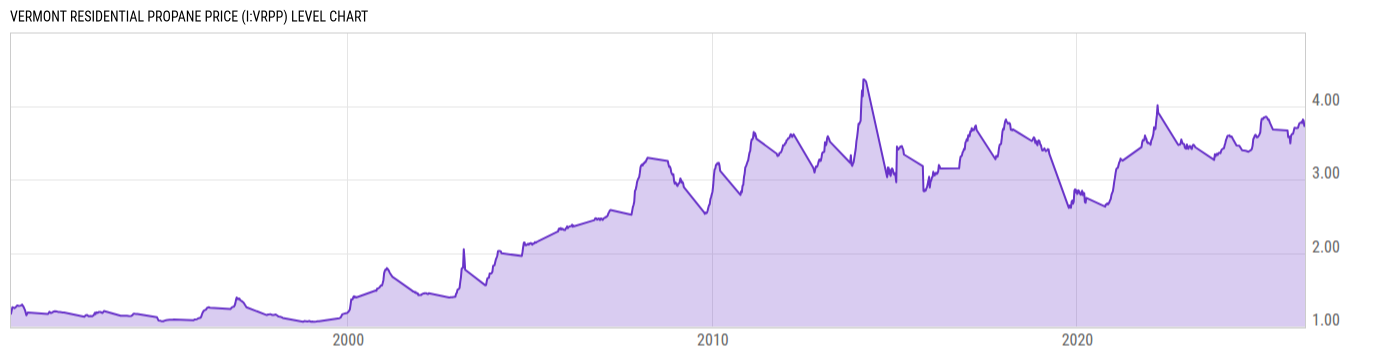
Vermont Residential Propane Price (I:VRPP)
3.733 USD/gal for Wk of Mar 30 2026
Level Chart
Basic Info
|
Vermont Residential Propane Price is at a current level of 3.733, up from 3.728 last week and down from 3.814 one year ago. This is a change of 0.13% from last week and -2.12% from one year ago. |
| Report | Weekly Heating Oil and Propane Prices |
| Category | Energy |
| Region | United States |
| Source | Energy Information Administration |
Stats
| Last Value | 3.733 |
| Latest Period | Mar 30 2026 |
| Last Updated | Apr 1 2026, 16:33 EDT |
| Next Release | Oct 7 2026, 13:00 EDT |
| Average Growth Rate | 9.32% |
| Value from Last Week | 3.728 |
| Change from Last Week | 0.13% |
| Value from 1 Year Ago | 3.814 |
| Change from 1 Year Ago | -2.12% |
| Frequency | Weekly |
| Unit | USD per Gallon |
| Adjustment | N/A |
| Download Source File |
Historical Data
| Date | Value |
|---|---|
| March 30, 2026 | 3.733 |
| March 23, 2026 | 3.728 |
| March 16, 2026 | 3.801 |
| March 09, 2026 | 3.815 |
| March 02, 2026 | 3.768 |
| February 23, 2026 | 3.784 |
| February 16, 2026 | 3.771 |
| February 09, 2026 | 3.77 |
| February 02, 2026 | 3.765 |
| January 26, 2026 | 3.738 |
| January 19, 2026 | 3.703 |
| January 12, 2026 | 3.70 |
| January 05, 2026 | 3.698 |
| December 29, 2025 | 3.703 |
| December 22, 2025 | 3.699 |
| December 15, 2025 | 3.703 |
| December 08, 2025 | 3.665 |
| December 01, 2025 | 3.624 |
| November 24, 2025 | 3.618 |
| November 17, 2025 | 3.615 |
| November 10, 2025 | 3.594 |
| November 03, 2025 | 3.492 |
| October 27, 2025 | 3.583 |
| October 20, 2025 | 3.572 |
| October 13, 2025 | 3.577 |
| Date | Value |
|---|---|
| October 06, 2025 | 3.668 |
| May 12, 2025 | 3.681 |
| April 14, 2025 | 3.766 |
| March 31, 2025 | 3.817 |
| March 24, 2025 | 3.814 |
| March 17, 2025 | 3.837 |
| March 10, 2025 | 3.85 |
| March 03, 2025 | 3.854 |
| February 24, 2025 | 3.851 |
| February 17, 2025 | 3.843 |
| February 10, 2025 | 3.844 |
| February 03, 2025 | 3.823 |
| January 27, 2025 | 3.827 |
| January 20, 2025 | 3.824 |
| January 13, 2025 | 3.763 |
| January 06, 2025 | 3.642 |
| December 30, 2024 | 3.617 |
| December 23, 2024 | 3.599 |
| December 16, 2024 | 3.585 |
| December 09, 2024 | 3.574 |
| December 02, 2024 | 3.574 |
| November 25, 2024 | 3.597 |
| November 18, 2024 | 3.609 |
| November 11, 2024 | 3.594 |
| November 04, 2024 | 3.566 |
News
Headline
Time (ET)
07/15 09:36
Basic Info
|
Vermont Residential Propane Price is at a current level of 3.733, up from 3.728 last week and down from 3.814 one year ago. This is a change of 0.13% from last week and -2.12% from one year ago. |
| Report | Weekly Heating Oil and Propane Prices |
| Category | Energy |
| Region | United States |
| Source | Energy Information Administration |
Stats
| Last Value | 3.733 |
| Latest Period | Mar 30 2026 |
| Last Updated | Apr 1 2026, 16:33 EDT |
| Next Release | Oct 7 2026, 13:00 EDT |
| Average Growth Rate | 9.32% |
| Value from Last Week | 3.728 |
| Change from Last Week | 0.13% |
| Value from 1 Year Ago | 3.814 |
| Change from 1 Year Ago | -2.12% |
| Frequency | Weekly |
| Unit | USD per Gallon |
| Adjustment | N/A |
| Download Source File |