

US Trade, Transportation, and Utilities Employment Forecast (I:USTTUE)
27.93M for Q4 2035
Level Chart
Basic Info
|
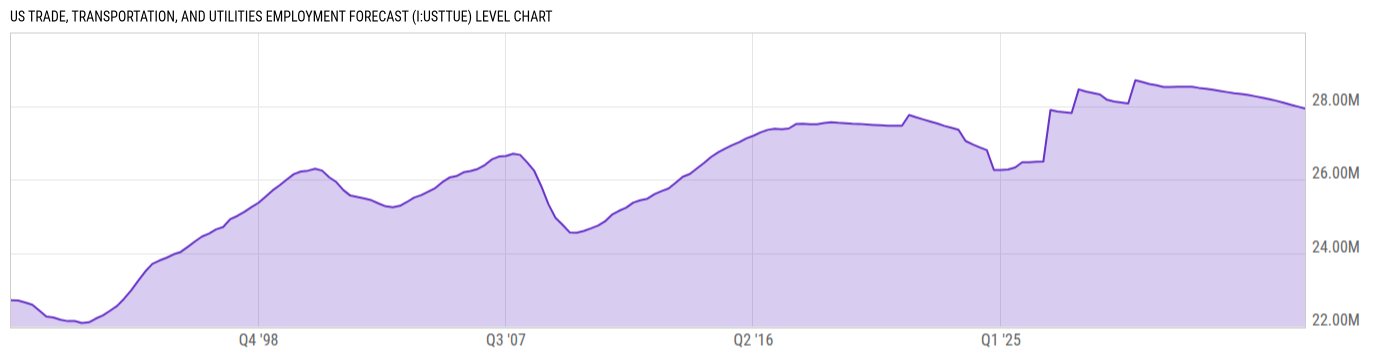
US Trade, Transportation, and Utilities Employment Forecast is at a current level of 27.93M, down from 27.98M last quarter and down from 28.14M one year ago. This is a change of -0.18% from last quarter and -0.73% from one year ago. |
| Report | Oregon Economic Forecast |
| Category | Economic Sentiment, Outlook and Activity |
| Region | United States |
| Source | Oregon Office of Economic Analysis |
Stats
| Last Value | 27.93M |
| Latest Period | Dec 2035 |
| Last Updated | Mar 1 2026, 10:30 EST |
| Next Release | May 20 2026, 10:30 EDT (E) |
| Average Growth Rate | 0.46% |
| Value from Last Quarter | 27.98M |
| Change from Last Quarter | -0.18% |
| Value from 1 Year Ago | 28.14M |
| Change from 1 Year Ago | -0.73% |
| Frequency | Quarterly |
| Adjustment | N/A |
| Download Source File |
Historical Data
| Date | Value |
|---|---|
| December 31, 2035 | 27.93M |
| September 30, 2035 | 27.98M |
| June 30, 2035 | 28.03M |
| March 31, 2035 | 28.09M |
| December 31, 2034 | 28.14M |
| September 30, 2034 | 28.18M |
| June 30, 2034 | 28.22M |
| March 31, 2034 | 28.26M |
| December 31, 2033 | 28.30M |
| September 30, 2033 | 28.33M |
| June 30, 2033 | 28.35M |
| March 31, 2033 | 28.38M |
| December 31, 2032 | 28.41M |
| September 30, 2032 | 28.44M |
| June 30, 2032 | 28.47M |
| March 31, 2032 | 28.49M |
| December 31, 2031 | 28.52M |
| September 30, 2031 | 28.52M |
| June 30, 2031 | 28.52M |
| March 31, 2031 | 28.52M |
| December 31, 2030 | 28.52M |
| September 30, 2030 | 28.57M |
| June 30, 2030 | 28.60M |
| March 31, 2030 | 28.65M |
| December 31, 2029 | 28.70M |
| Date | Value |
|---|---|
| September 30, 2029 | 28.07M |
| June 30, 2029 | 28.10M |
| March 31, 2029 | 28.12M |
| December 31, 2028 | 28.17M |
| September 30, 2028 | 28.31M |
| June 30, 2028 | 28.35M |
| March 31, 2028 | 28.40M |
| December 31, 2027 | 28.45M |
| September 30, 2027 | 27.81M |
| June 30, 2027 | 27.83M |
| March 31, 2027 | 27.85M |
| December 31, 2026 | 27.89M |
| September 30, 2026 | 26.49M |
| June 30, 2026 | 26.48M |
| March 31, 2026 | 26.47M |
| December 31, 2025 | 26.47M |
| September 30, 2025 | 26.33M |
| June 30, 2025 | 26.27M |
| March 31, 2025 | 26.26M |
| December 31, 2024 | 26.26M |
| September 30, 2024 | 26.80M |
| June 30, 2024 | 26.88M |
| March 31, 2024 | 26.96M |
| December 31, 2023 | 27.05M |
| September 30, 2023 | 27.35M |
News
Headline
Time (ET)
05/05 07:10
05/04 12:29
Canada's Federal Govt May "Hit" Its Deficit For FY25-26, Over Even Come In Lower, says Scotia's Holt
04/28 08:45
04/15 07:26
Basic Info
|
US Trade, Transportation, and Utilities Employment Forecast is at a current level of 27.93M, down from 27.98M last quarter and down from 28.14M one year ago. This is a change of -0.18% from last quarter and -0.73% from one year ago. |
| Report | Oregon Economic Forecast |
| Category | Economic Sentiment, Outlook and Activity |
| Region | United States |
| Source | Oregon Office of Economic Analysis |
Stats
| Last Value | 27.93M |
| Latest Period | Dec 2035 |
| Last Updated | Mar 1 2026, 10:30 EST |
| Next Release | May 20 2026, 10:30 EDT (E) |
| Average Growth Rate | 0.46% |
| Value from Last Quarter | 27.98M |
| Change from Last Quarter | -0.18% |
| Value from 1 Year Ago | 28.14M |
| Change from 1 Year Ago | -0.73% |
| Frequency | Quarterly |
| Adjustment | N/A |
| Download Source File |