

US Crude Oil Stocks (I:USCOES)
Level Chart
Basic Info
|
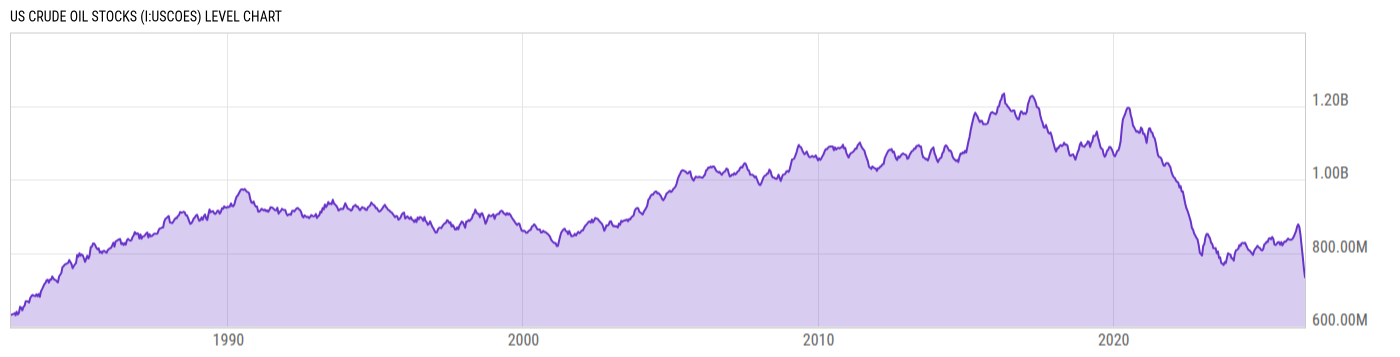
US Crude Oil Stocks is at a current level of 723.12M, down from 726.17M last week and down from 824.86M one year ago. This is a change of -0.42% from last week and -12.33% from one year ago. |
|
US Crude Oil Stocks reflects the domestic weekly stocks of US oil. This value, as a reflection of US crude oil supply/demand dynamics, has market-moving impact on oil prices when the estimates are either under or overestimated. In periods of low prices or low oil demand, US oil suppliers can be observed to stockpile oil inventories. |
| Report | Weekly Petroleum Status |
| Category | Energy |
| Region | N/A |
| Source | Energy Information Administration |
Stats
| Last Value | 723.12M |
| Latest Period | Jul 17 2026 |
| Last Updated | Jul 22 2026, 12:05 EDT |
| Next Release | Jul 29 2026, 12:00 EDT |
| Average Growth Rate | 0.38% |
| Value from Last Week | 726.17M |
| Change from Last Week | -0.42% |
| Value from 1 Year Ago | 824.86M |
| Change from 1 Year Ago | -12.33% |
| Frequency | Weekly |
| Unit | Barrels |
| Adjustment | N/A |
| Download Source File |
Historical Data
| Date | Value |
|---|---|
| July 17, 2026 | 723.12M |
| July 10, 2026 | 726.17M |
| July 03, 2026 | 730.85M |
| June 26, 2026 | 734.01M |
| June 19, 2026 | 743.32M |
| June 12, 2026 | 758.47M |
| June 05, 2026 | 775.68M |
| May 29, 2026 | 790.83M |
| May 22, 2026 | 806.80M |
| May 15, 2026 | 819.19M |
| May 08, 2026 | 836.97M |
| May 01, 2026 | 849.88M |
| April 24, 2026 | 857.42M |
| April 17, 2026 | 870.77M |
| April 10, 2026 | 872.98M |
| April 03, 2026 | 878.04M |
| March 27, 2026 | 876.70M |
| March 20, 2026 | 871.63M |
| March 13, 2026 | 864.70M |
| March 06, 2026 | 858.54M |
| February 27, 2026 | 854.72M |
| February 20, 2026 | 851.24M |
| February 13, 2026 | 835.26M |
| February 06, 2026 | 844.04M |
| January 30, 2026 | 835.51M |
| Date | Value |
|---|---|
| January 23, 2026 | 838.75M |
| January 16, 2026 | 840.53M |
| January 09, 2026 | 836.12M |
| January 02, 2026 | 832.52M |
| December 26, 2025 | 836.11M |
| December 19, 2025 | 837.79M |
| December 12, 2025 | 836.59M |
| December 05, 2025 | 837.61M |
| November 28, 2025 | 839.18M |
| November 21, 2025 | 838.35M |
| November 14, 2025 | 835.08M |
| November 07, 2025 | 837.97M |
| October 31, 2025 | 830.76M |
| October 24, 2025 | 825.06M |
| October 17, 2025 | 831.39M |
| October 10, 2025 | 831.53M |
| October 03, 2025 | 827.25M |
| September 26, 2025 | 823.25M |
| September 19, 2025 | 820.71M |
| September 12, 2025 | 821.09M |
| September 05, 2025 | 829.87M |
| August 29, 2025 | 825.42M |
| August 22, 2025 | 822.49M |
| August 15, 2025 | 824.11M |
| August 08, 2025 | 829.90M |
News
Basic Info
|
US Crude Oil Stocks is at a current level of 723.12M, down from 726.17M last week and down from 824.86M one year ago. This is a change of -0.42% from last week and -12.33% from one year ago. |
|
US Crude Oil Stocks reflects the domestic weekly stocks of US oil. This value, as a reflection of US crude oil supply/demand dynamics, has market-moving impact on oil prices when the estimates are either under or overestimated. In periods of low prices or low oil demand, US oil suppliers can be observed to stockpile oil inventories. |
| Report | Weekly Petroleum Status |
| Category | Energy |
| Region | N/A |
| Source | Energy Information Administration |
Stats
| Last Value | 723.12M |
| Latest Period | Jul 17 2026 |
| Last Updated | Jul 22 2026, 12:05 EDT |
| Next Release | Jul 29 2026, 12:00 EDT |
| Average Growth Rate | 0.38% |
| Value from Last Week | 726.17M |
| Change from Last Week | -0.42% |
| Value from 1 Year Ago | 824.86M |
| Change from 1 Year Ago | -12.33% |
| Frequency | Weekly |
| Unit | Barrels |
| Adjustment | N/A |
| Download Source File |