

US Total Vehicle Sales (I:USVS)
1.401M for Apr 2026
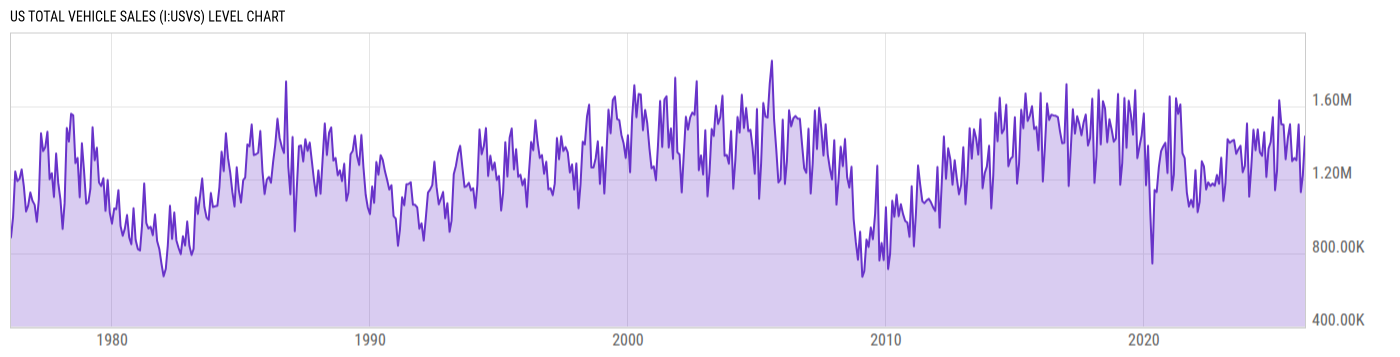
Level Chart
Basic Info
|
US Total Vehicle Sales is at a current level of 1.401M, down from 1.421M last month and down from 1.500M one year ago. This is a change of -1.37% from last month and -6.61% from one year ago. |
| Report | Supplemental Estimates |
| Category | Retail and Services Business Statistics |
| Region | United States |
| Source | Bureau of Economic Analysis |
Stats
| Last Value | 1.401M |
| Latest Period | Apr 2026 |
| Last Updated | May 28 2026, 10:02 EDT |
| Next Release | Jun 25 2026, 10:00 EDT |
| Average Growth Rate | 12.13% |
| Value from Last Month | 1.421M |
| Change from Last Month | -1.37% |
| Value from 1 Year Ago | 1.500M |
| Change from 1 Year Ago | -6.61% |
| Frequency | Monthly |
| Adjustment | Not Seasonally Adjusted |
| Download Source File |
Historical Data
| Date | Value |
|---|---|
| April 30, 2026 | 1.401M |
| March 31, 2026 | 1.421M |
| February 28, 2026 | 1.205M |
| January 31, 2026 | 1.116M |
| December 31, 2025 | 1.499M |
| November 30, 2025 | 1.305M |
| October 31, 2025 | 1.317M |
| September 30, 2025 | 1.299M |
| August 31, 2025 | 1.500M |
| July 31, 2025 | 1.426M |
| June 30, 2025 | 1.311M |
| May 31, 2025 | 1.498M |
| April 30, 2025 | 1.500M |
| March 31, 2025 | 1.632M |
| February 28, 2025 | 1.247M |
| January 31, 2025 | 1.142M |
| December 31, 2024 | 1.539M |
| November 30, 2024 | 1.404M |
| October 31, 2024 | 1.368M |
| September 30, 2024 | 1.213M |
| August 31, 2024 | 1.457M |
| July 31, 2024 | 1.329M |
| June 30, 2024 | 1.348M |
| May 31, 2024 | 1.473M |
| April 30, 2024 | 1.359M |
| Date | Value |
|---|---|
| March 31, 2024 | 1.471M |
| February 29, 2024 | 1.265M |
| January 31, 2024 | 1.107M |
| December 31, 2023 | 1.505M |
| November 30, 2023 | 1.273M |
| October 31, 2023 | 1.239M |
| September 30, 2023 | 1.383M |
| August 31, 2023 | 1.365M |
| July 31, 2023 | 1.340M |
| June 30, 2023 | 1.415M |
| May 31, 2023 | 1.410M |
| April 30, 2023 | 1.400M |
| March 31, 2023 | 1.420M |
| February 28, 2023 | 1.176M |
| January 31, 2023 | 1.083M |
| December 31, 2022 | 1.319M |
| November 30, 2022 | 1.177M |
| October 31, 2022 | 1.225M |
| September 30, 2022 | 1.166M |
| August 31, 2022 | 1.178M |
| July 31, 2022 | 1.165M |
| June 30, 2022 | 1.184M |
| May 31, 2022 | 1.146M |
| April 30, 2022 | 1.272M |
| March 31, 2022 | 1.299M |
News
Headline
Time (ET)
Basic Info
|
US Total Vehicle Sales is at a current level of 1.401M, down from 1.421M last month and down from 1.500M one year ago. This is a change of -1.37% from last month and -6.61% from one year ago. |
| Report | Supplemental Estimates |
| Category | Retail and Services Business Statistics |
| Region | United States |
| Source | Bureau of Economic Analysis |
Stats
| Last Value | 1.401M |
| Latest Period | Apr 2026 |
| Last Updated | May 28 2026, 10:02 EDT |
| Next Release | Jun 25 2026, 10:00 EDT |
| Average Growth Rate | 12.13% |
| Value from Last Month | 1.421M |
| Change from Last Month | -1.37% |
| Value from 1 Year Ago | 1.500M |
| Change from 1 Year Ago | -6.61% |
| Frequency | Monthly |
| Adjustment | Not Seasonally Adjusted |
| Download Source File |