

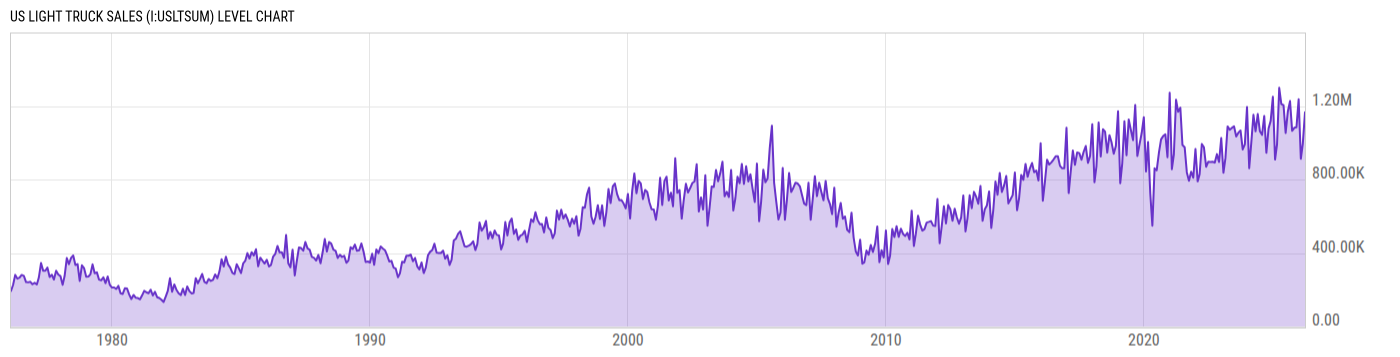
US Light Truck Sales (I:USLTSUM)
1.133M for Apr 2026
Level Chart
Basic Info
|
US Light Truck Sales is at a current level of 1.133M, down from 1.157M last month and down from 1.210M one year ago. This is a change of -2.04% from last month and -6.35% from one year ago. |
| Report | Supplemental Estimates |
| Category | Retail and Services Business Statistics |
| Region | United States |
| Source | Bureau of Economic Analysis |
Stats
| Last Value | 1.133M |
| Latest Period | Apr 2026 |
| Last Updated | May 28 2026, 10:01 EDT |
| Next Release | Jun 25 2026, 10:00 EDT |
| Average Growth Rate | 16.11% |
| Value from Last Month | 1.157M |
| Change from Last Month | -2.04% |
| Value from 1 Year Ago | 1.210M |
| Change from 1 Year Ago | -6.35% |
| Frequency | Monthly |
| Adjustment | Not Seasonally Adjusted |
| Download Source File |
Historical Data
| Date | Value |
|---|---|
| April 30, 2026 | 1.133M |
| March 31, 2026 | 1.157M |
| February 28, 2026 | 988.10K |
| January 31, 2026 | 907.87K |
| December 31, 2025 | 1.236M |
| November 30, 2025 | 1.084M |
| October 31, 2025 | 1.081M |
| September 30, 2025 | 1.065M |
| August 31, 2025 | 1.227M |
| July 31, 2025 | 1.170M |
| June 30, 2025 | 1.053M |
| May 31, 2025 | 1.204M |
| April 30, 2025 | 1.210M |
| March 31, 2025 | 1.299M |
| February 28, 2025 | 991.62K |
| January 31, 2025 | 908.79K |
| December 31, 2024 | 1.250M |
| November 30, 2024 | 1.119M |
| October 31, 2024 | 1.078M |
| September 30, 2024 | 945.28K |
| August 31, 2024 | 1.146M |
| July 31, 2024 | 1.043M |
| June 30, 2024 | 1.063M |
| May 31, 2024 | 1.156M |
| April 30, 2024 | 1.062M |
| Date | Value |
|---|---|
| March 31, 2024 | 1.152M |
| February 29, 2024 | 998.17K |
| January 31, 2024 | 861.69K |
| December 31, 2023 | 1.194M |
| November 30, 2023 | 990.66K |
| October 31, 2023 | 963.79K |
| September 30, 2023 | 1.067M |
| August 31, 2023 | 1.055M |
| July 31, 2023 | 1.034M |
| June 30, 2023 | 1.090M |
| May 31, 2023 | 1.081M |
| April 30, 2023 | 1.070M |
| March 31, 2023 | 1.089M |
| February 28, 2023 | 914.75K |
| January 31, 2023 | 836.68K |
| December 31, 2022 | 1.026M |
| November 30, 2022 | 895.61K |
| October 31, 2022 | 938.00K |
| September 30, 2022 | 891.71K |
| August 31, 2022 | 896.57K |
| July 31, 2022 | 895.34K |
| June 30, 2022 | 895.94K |
| May 31, 2022 | 869.41K |
| April 30, 2022 | 975.37K |
| March 31, 2022 | 993.46K |
News
Headline
Time (ET)
Basic Info
|
US Light Truck Sales is at a current level of 1.133M, down from 1.157M last month and down from 1.210M one year ago. This is a change of -2.04% from last month and -6.35% from one year ago. |
| Report | Supplemental Estimates |
| Category | Retail and Services Business Statistics |
| Region | United States |
| Source | Bureau of Economic Analysis |
Stats
| Last Value | 1.133M |
| Latest Period | Apr 2026 |
| Last Updated | May 28 2026, 10:01 EDT |
| Next Release | Jun 25 2026, 10:00 EDT |
| Average Growth Rate | 16.11% |
| Value from Last Month | 1.157M |
| Change from Last Month | -2.04% |
| Value from 1 Year Ago | 1.210M |
| Change from 1 Year Ago | -6.35% |
| Frequency | Monthly |
| Adjustment | Not Seasonally Adjusted |
| Download Source File |