

US Foreign Auto Sales (I:USFAS)
75.03K for Apr 2026
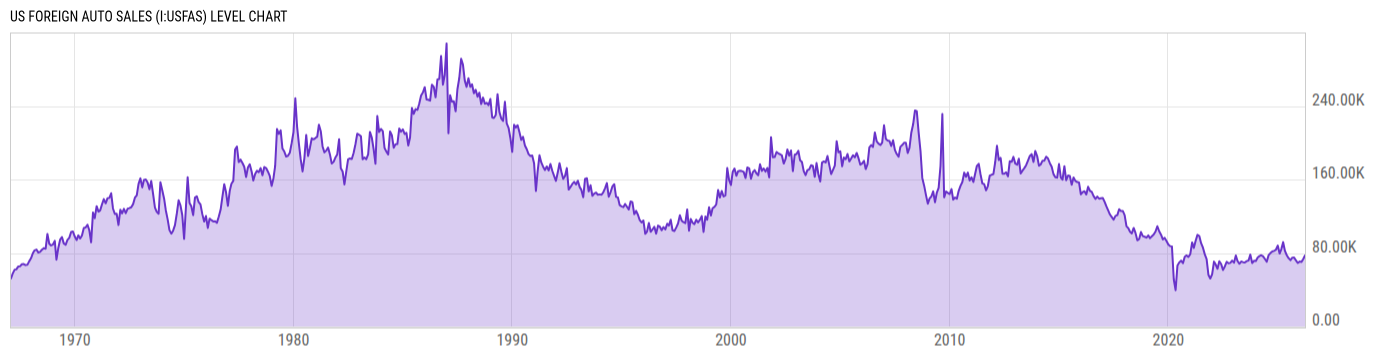
Level Chart
Basic Info
|
US Foreign Auto Sales is at a current level of 75.03K, up from 74.31K last month and down from 82.21K one year ago. This is a change of 0.97% from last month and -8.73% from one year ago. |
| Report | Supplemental Estimates |
| Category | Retail and Services Business Statistics |
| Region | United States |
| Source | Bureau of Economic Analysis |
Stats
| Last Value | 75.03K |
| Latest Period | Apr 2026 |
| Last Updated | May 28 2026, 10:02 EDT |
| Next Release | Jun 25 2026, 10:00 EDT |
| Average Growth Rate | 4.19% |
| Value from Last Month | 74.31K |
| Change from Last Month | 0.97% |
| Value from 1 Year Ago | 82.21K |
| Change from 1 Year Ago | -8.73% |
| Frequency | Monthly |
| Adjustment | Seasonally Adjusted |
| Download Source File |
Historical Data
| Date | Value |
|---|---|
| April 30, 2026 | 75.03K |
| March 31, 2026 | 74.31K |
| February 28, 2026 | 71.12K |
| January 31, 2026 | 68.52K |
| December 31, 2025 | 70.64K |
| November 30, 2025 | 69.14K |
| October 31, 2025 | 71.93K |
| September 30, 2025 | 75.13K |
| August 31, 2025 | 74.88K |
| July 31, 2025 | 72.17K |
| June 30, 2025 | 74.38K |
| May 31, 2025 | 77.58K |
| April 30, 2025 | 82.21K |
| March 31, 2025 | 91.83K |
| February 28, 2025 | 84.03K |
| January 31, 2025 | 79.37K |
| December 31, 2024 | 88.08K |
| November 30, 2024 | 83.54K |
| October 31, 2024 | 82.30K |
| September 30, 2024 | 81.62K |
| August 31, 2024 | 79.96K |
| July 31, 2024 | 77.62K |
| June 30, 2024 | 70.44K |
| May 31, 2024 | 73.46K |
| April 30, 2024 | 76.25K |
| Date | Value |
|---|---|
| March 31, 2024 | 77.60K |
| February 29, 2024 | 76.59K |
| January 31, 2024 | 75.10K |
| December 31, 2023 | 71.21K |
| November 30, 2023 | 71.49K |
| October 31, 2023 | 69.03K |
| September 30, 2023 | 78.26K |
| August 31, 2023 | 71.81K |
| July 31, 2023 | 71.16K |
| June 30, 2023 | 69.63K |
| May 31, 2023 | 70.03K |
| April 30, 2023 | 70.66K |
| March 31, 2023 | 68.28K |
| February 28, 2023 | 71.31K |
| January 31, 2023 | 77.26K |
| December 31, 2022 | 69.50K |
| November 30, 2022 | 71.64K |
| October 31, 2022 | 69.27K |
| September 30, 2022 | 68.81K |
| August 31, 2022 | 70.36K |
| July 31, 2022 | 65.34K |
| June 30, 2022 | 61.44K |
| May 31, 2022 | 68.07K |
| April 30, 2022 | 70.92K |
| March 31, 2022 | 62.88K |
News
Headline
Time (ET)
Basic Info
|
US Foreign Auto Sales is at a current level of 75.03K, up from 74.31K last month and down from 82.21K one year ago. This is a change of 0.97% from last month and -8.73% from one year ago. |
| Report | Supplemental Estimates |
| Category | Retail and Services Business Statistics |
| Region | United States |
| Source | Bureau of Economic Analysis |
Stats
| Last Value | 75.03K |
| Latest Period | Apr 2026 |
| Last Updated | May 28 2026, 10:02 EDT |
| Next Release | Jun 25 2026, 10:00 EDT |
| Average Growth Rate | 4.19% |
| Value from Last Month | 74.31K |
| Change from Last Month | 0.97% |
| Value from 1 Year Ago | 82.21K |
| Change from 1 Year Ago | -8.73% |
| Frequency | Monthly |
| Adjustment | Seasonally Adjusted |
| Download Source File |