

US Domestic Auto Sales (I:USDAS)
147.06K for Mar 2026
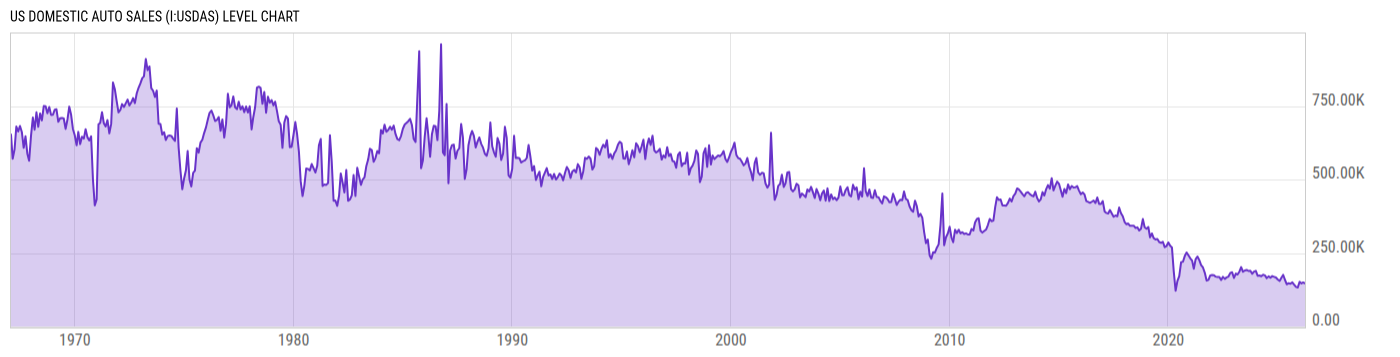
Level Chart
Basic Info
|
US Domestic Auto Sales is at a current level of 147.06K, down from 149.72K last month and down from 175.54K one year ago. This is a change of -1.78% from last month and -16.23% from one year ago. |
| Report | Supplemental Estimates |
| Category | Retail and Services Business Statistics |
| Region | United States |
| Source | Bureau of Economic Analysis |
Stats
| Last Value | 147.06K |
| Latest Period | Mar 2026 |
| Last Updated | Apr 30 2026, 10:37 EDT |
| Next Release | May 28 2026, 10:00 EDT |
| Average Growth Rate | 1.76% |
| Value from Last Month | 149.72K |
| Change from Last Month | -1.78% |
| Value from 1 Year Ago | 175.54K |
| Change from 1 Year Ago | -16.23% |
| Frequency | Monthly |
| Adjustment | Seasonally Adjusted |
| Download Source File |
Historical Data
| Date | Value |
|---|---|
| March 31, 2026 | 147.06K |
| February 28, 2026 | 149.72K |
| January 31, 2026 | 146.51K |
| December 31, 2025 | 151.87K |
| November 30, 2025 | 132.44K |
| October 31, 2025 | 134.67K |
| September 30, 2025 | 142.31K |
| August 31, 2025 | 150.08K |
| July 31, 2025 | 145.32K |
| June 30, 2025 | 147.28K |
| May 31, 2025 | 143.54K |
| April 30, 2025 | 159.02K |
| March 31, 2025 | 175.54K |
| February 28, 2025 | 164.94K |
| January 31, 2025 | 155.07K |
| December 31, 2024 | 159.88K |
| November 30, 2024 | 166.60K |
| October 31, 2024 | 168.92K |
| September 30, 2024 | 171.37K |
| August 31, 2024 | 166.12K |
| July 31, 2024 | 170.53K |
| June 30, 2024 | 164.50K |
| May 31, 2024 | 174.00K |
| April 30, 2024 | 176.00K |
| March 31, 2024 | 171.10K |
| Date | Value |
|---|---|
| February 29, 2024 | 173.47K |
| January 31, 2024 | 172.45K |
| December 31, 2023 | 189.13K |
| November 30, 2023 | 186.39K |
| October 31, 2023 | 179.33K |
| September 30, 2023 | 189.81K |
| August 31, 2023 | 188.78K |
| July 31, 2023 | 192.37K |
| June 30, 2023 | 190.42K |
| May 31, 2023 | 186.13K |
| April 30, 2023 | 202.07K |
| March 31, 2023 | 186.48K |
| February 28, 2023 | 176.73K |
| January 31, 2023 | 180.22K |
| December 31, 2022 | 165.12K |
| November 30, 2022 | 184.51K |
| October 31, 2022 | 182.54K |
| September 30, 2022 | 169.94K |
| August 31, 2022 | 167.16K |
| July 31, 2022 | 162.05K |
| June 30, 2022 | 168.93K |
| May 31, 2022 | 158.26K |
| April 30, 2022 | 168.50K |
| March 31, 2022 | 168.30K |
| February 28, 2022 | 169.62K |
News
Headline
Time (ET)
05/12 07:21
04/24 07:42
04/23 08:36
Basic Info
|
US Domestic Auto Sales is at a current level of 147.06K, down from 149.72K last month and down from 175.54K one year ago. This is a change of -1.78% from last month and -16.23% from one year ago. |
| Report | Supplemental Estimates |
| Category | Retail and Services Business Statistics |
| Region | United States |
| Source | Bureau of Economic Analysis |
Stats
| Last Value | 147.06K |
| Latest Period | Mar 2026 |
| Last Updated | Apr 30 2026, 10:37 EDT |
| Next Release | May 28 2026, 10:00 EDT |
| Average Growth Rate | 1.76% |
| Value from Last Month | 149.72K |
| Change from Last Month | -1.78% |
| Value from 1 Year Ago | 175.54K |
| Change from 1 Year Ago | -16.23% |
| Frequency | Monthly |
| Adjustment | Seasonally Adjusted |
| Download Source File |