

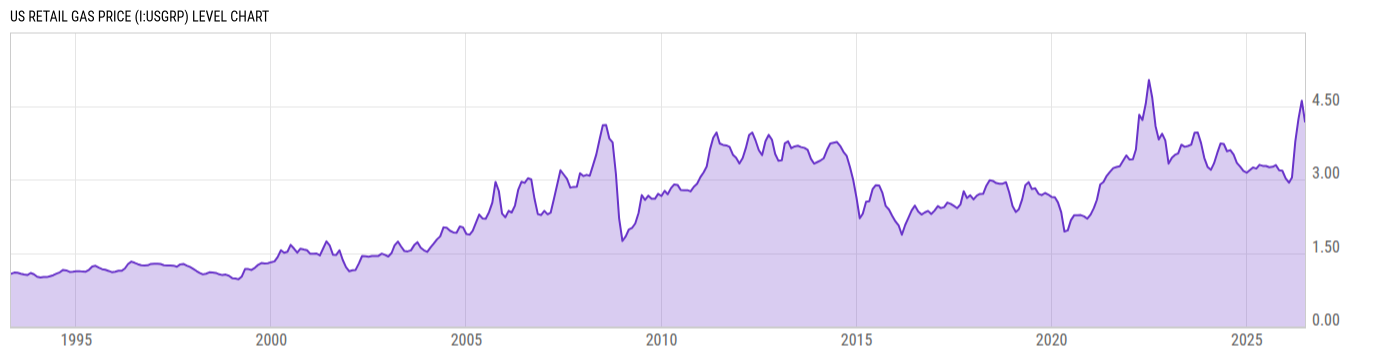
US Retail Gas Price (I:USGRP)
4.184 USD/gal for Jun 2026
Level Chart
Basic Info
|
US Retail Gas Price is at a current level of 4.184, down from 4.609 last month and up from 3.276 one year ago. This is a change of -9.22% from last month and 27.72% from one year ago. |
| Report | Weekly Retail Gasoline and On-Highway Diesel Prices |
| Category | Energy |
| Region | United States |
| Source | Energy Information Administration |
Stats
| Last Value | 4.184 |
| Latest Period | Jun 2026 |
| Last Updated | Jun 30 2026, 23:05 EDT |
| Next Release | Jul 28 2026, 16:30 EDT |
| Average Growth Rate | 6.10% |
| Value from Last Month | 4.609 |
| Change from Last Month | -9.22% |
| Value from 1 Year Ago | 3.276 |
| Change from 1 Year Ago | 27.72% |
| Frequency | Monthly |
| Unit | USD per Gallon |
| Adjustment | N/A |
| Download Source File | |
| Notes | Includes both conventional and reformulated areas and all grades of gasoline. |
Historical Data
| Date | Value |
|---|---|
| June 30, 2026 | 4.184 |
| May 31, 2026 | 4.609 |
| April 30, 2026 | 4.236 |
| March 31, 2026 | 3.771 |
| February 28, 2026 | 3.039 |
| January 31, 2026 | 2.936 |
| December 31, 2025 | 3.024 |
| November 30, 2025 | 3.179 |
| October 31, 2025 | 3.19 |
| September 30, 2025 | 3.293 |
| August 31, 2025 | 3.258 |
| July 31, 2025 | 3.25 |
| June 30, 2025 | 3.276 |
| May 31, 2025 | 3.278 |
| April 30, 2025 | 3.299 |
| March 31, 2025 | 3.223 |
| February 28, 2025 | 3.247 |
| January 31, 2025 | 3.196 |
| December 31, 2024 | 3.139 |
| November 30, 2024 | 3.175 |
| October 31, 2024 | 3.261 |
| September 30, 2024 | 3.338 |
| August 31, 2024 | 3.507 |
| July 31, 2024 | 3.60 |
| June 30, 2024 | 3.576 |
| Date | Value |
|---|---|
| May 31, 2024 | 3.725 |
| April 30, 2024 | 3.733 |
| March 31, 2024 | 3.542 |
| February 29, 2024 | 3.328 |
| January 31, 2024 | 3.197 |
| December 31, 2023 | 3.257 |
| November 30, 2023 | 3.443 |
| October 31, 2023 | 3.742 |
| September 30, 2023 | 3.958 |
| August 31, 2023 | 3.954 |
| July 31, 2023 | 3.712 |
| June 30, 2023 | 3.684 |
| May 31, 2023 | 3.666 |
| April 30, 2023 | 3.711 |
| March 31, 2023 | 3.535 |
| February 28, 2023 | 3.501 |
| January 31, 2023 | 3.445 |
| December 31, 2022 | 3.324 |
| November 30, 2022 | 3.799 |
| October 31, 2022 | 3.935 |
| September 30, 2022 | 3.817 |
| August 31, 2022 | 4.087 |
| July 31, 2022 | 4.668 |
| June 30, 2022 | 5.032 |
| May 31, 2022 | 4.545 |
News
Headline
Time (ET)
07/20 12:48
Basic Info
|
US Retail Gas Price is at a current level of 4.184, down from 4.609 last month and up from 3.276 one year ago. This is a change of -9.22% from last month and 27.72% from one year ago. |
| Report | Weekly Retail Gasoline and On-Highway Diesel Prices |
| Category | Energy |
| Region | United States |
| Source | Energy Information Administration |
Stats
| Last Value | 4.184 |
| Latest Period | Jun 2026 |
| Last Updated | Jun 30 2026, 23:05 EDT |
| Next Release | Jul 28 2026, 16:30 EDT |
| Average Growth Rate | 6.10% |
| Value from Last Month | 4.609 |
| Change from Last Month | -9.22% |
| Value from 1 Year Ago | 3.276 |
| Change from 1 Year Ago | 27.72% |
| Frequency | Monthly |
| Unit | USD per Gallon |
| Adjustment | N/A |
| Download Source File | |
| Notes | Includes both conventional and reformulated areas and all grades of gasoline. |