

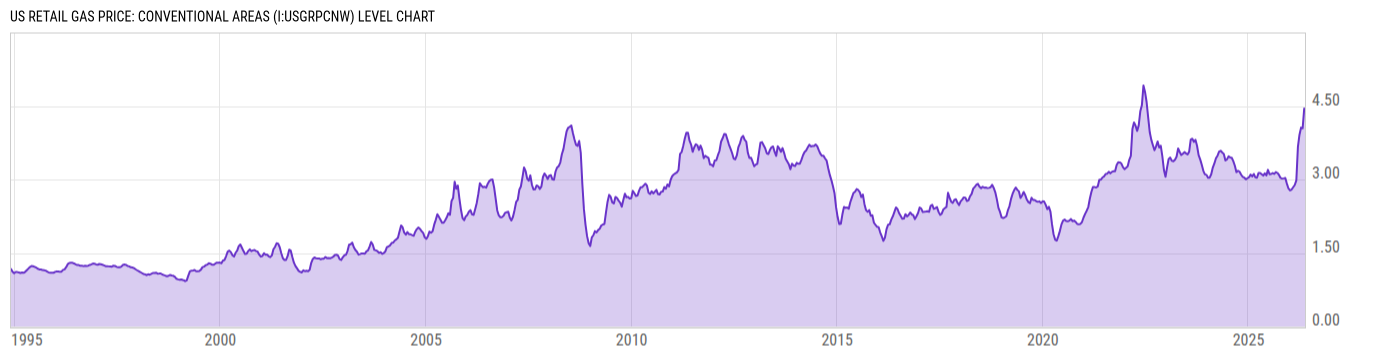
US Retail Gas Price: Conventional Areas (I:USGRPCNW)
4.43 USD/gal for Wk of May 18 2026
Level Chart
Basic Info
|
US Retail Gas Price: Conventional Areas is at a current level of 4.43, down from 4.447 last week and up from 3.08 one year ago. This is a change of -0.38% from last week and 43.83% from one year ago. |
| Report | Weekly Retail Gasoline and On-Highway Diesel Prices |
| Category | Energy |
| Region | United States |
| Source | Energy Information Administration |
Stats
| Last Value | 4.43 |
| Latest Period | May 18 2026 |
| Last Updated | May 19 2026, 17:07 EDT |
| Next Release | May 27 2026, 16:30 EDT |
| Average Growth Rate | 5.29% |
| Value from Last Week | 4.447 |
| Change from Last Week | -0.38% |
| Value from 1 Year Ago | 3.08 |
| Change from 1 Year Ago | 43.83% |
| Frequency | Weekly |
| Unit | USD per Gallon |
| Adjustment | N/A |
| Download Source File |
Historical Data
| Date | Value |
|---|---|
| May 18, 2026 | 4.43 |
| May 11, 2026 | 4.447 |
| May 04, 2026 | 4.398 |
| April 27, 2026 | 4.045 |
| April 20, 2026 | 3.984 |
| April 13, 2026 | 4.059 |
| April 06, 2026 | 4.046 |
| March 30, 2026 | 3.914 |
| March 23, 2026 | 3.887 |
| March 16, 2026 | 3.664 |
| March 09, 2026 | 3.459 |
| March 02, 2026 | 2.982 |
| February 23, 2026 | 2.894 |
| February 16, 2026 | 2.888 |
| February 09, 2026 | 2.865 |
| February 02, 2026 | 2.842 |
| January 26, 2026 | 2.841 |
| January 19, 2026 | 2.795 |
| January 12, 2026 | 2.759 |
| January 05, 2026 | 2.777 |
| December 29, 2025 | 2.787 |
| December 22, 2025 | 2.817 |
| December 15, 2025 | 2.869 |
| December 08, 2025 | 2.916 |
| December 01, 2025 | 2.951 |
| Date | Value |
|---|---|
| November 24, 2025 | 3.032 |
| November 17, 2025 | 3.035 |
| November 10, 2025 | 3.023 |
| November 03, 2025 | 2.996 |
| October 27, 2025 | 3.018 |
| October 20, 2025 | 2.997 |
| October 13, 2025 | 3.032 |
| October 06, 2025 | 3.098 |
| September 29, 2025 | 3.092 |
| September 22, 2025 | 3.147 |
| September 15, 2025 | 3.133 |
| September 08, 2025 | 3.165 |
| September 01, 2025 | 3.153 |
| August 25, 2025 | 3.133 |
| August 18, 2025 | 3.113 |
| August 11, 2025 | 3.111 |
| August 04, 2025 | 3.131 |
| July 28, 2025 | 3.117 |
| July 21, 2025 | 3.112 |
| July 14, 2025 | 3.111 |
| July 07, 2025 | 3.107 |
| June 30, 2025 | 3.14 |
| June 23, 2025 | 3.196 |
| June 16, 2025 | 3.117 |
| June 09, 2025 | 3.084 |
News
Headline
Time (ET)
05/22 06:05
Basic Info
|
US Retail Gas Price: Conventional Areas is at a current level of 4.43, down from 4.447 last week and up from 3.08 one year ago. This is a change of -0.38% from last week and 43.83% from one year ago. |
| Report | Weekly Retail Gasoline and On-Highway Diesel Prices |
| Category | Energy |
| Region | United States |
| Source | Energy Information Administration |
Stats
| Last Value | 4.43 |
| Latest Period | May 18 2026 |
| Last Updated | May 19 2026, 17:07 EDT |
| Next Release | May 27 2026, 16:30 EDT |
| Average Growth Rate | 5.29% |
| Value from Last Week | 4.447 |
| Change from Last Week | -0.38% |
| Value from 1 Year Ago | 3.08 |
| Change from 1 Year Ago | 43.83% |
| Frequency | Weekly |
| Unit | USD per Gallon |
| Adjustment | N/A |
| Download Source File |