

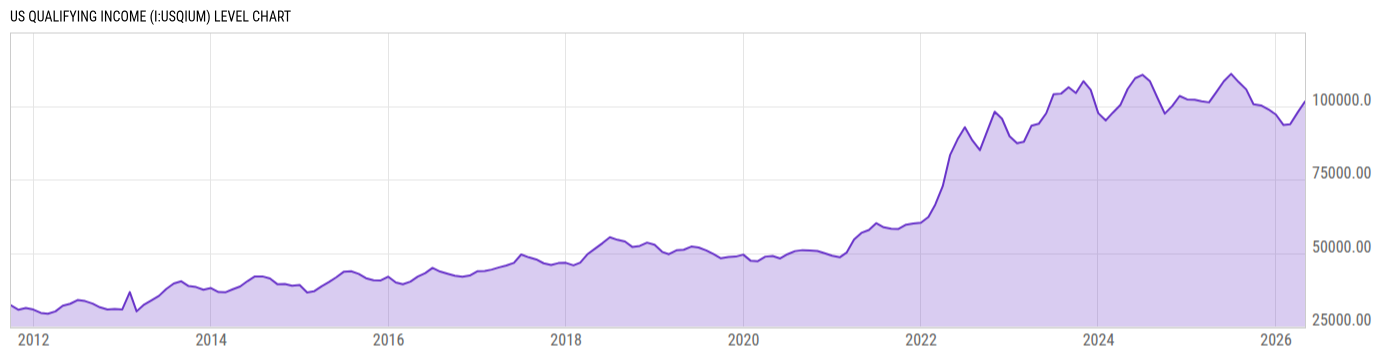
US Qualifying Income (I:USQIUM)
101520.0 USD for Apr 2026
Level Chart
Basic Info
|
US Qualifying Income is at a current level of 101520.0, up from 97824.00 last month and down from 104736.0 one year ago. This is a change of 3.78% from last month and -3.07% from one year ago. |
| Report | Monthly Report on Housing Affordability |
| Category | House Prices |
| Region | United States |
| Source | National Association of Realtors |
Stats
| Last Value | 101520.0 |
| Latest Period | Apr 2026 |
| Last Updated | May 11 2026, 11:03 EDT |
| Next Release | Jun 9 2026, 10:00 EDT |
| Average Growth Rate | 8.83% |
| Value from Last Month | 97824.00 |
| Change from Last Month | 3.78% |
| Value from 1 Year Ago | 104736.0 |
| Change from 1 Year Ago | -3.07% |
| Frequency | Monthly |
| Unit | USD |
| Adjustment | Not Seasonally Adjusted |
| Download Source File |
Historical Data
| Date | Value |
|---|---|
| April 30, 2026 | 101520.0 |
| March 31, 2026 | 97824.00 |
| February 28, 2026 | 93792.00 |
| January 31, 2026 | 93552.00 |
| December 31, 2025 | 97104.00 |
| November 30, 2025 | 98880.00 |
| October 31, 2025 | 100176.0 |
| September 30, 2025 | 100608.0 |
| August 31, 2025 | 105648.0 |
| July 31, 2025 | 108144.0 |
| June 30, 2025 | 110928.0 |
| May 31, 2025 | 108432.0 |
| April 30, 2025 | 104736.0 |
| March 31, 2025 | 101232.0 |
| February 28, 2025 | 101616.0 |
| January 31, 2025 | 102096.0 |
| December 31, 2024 | 102240.0 |
| November 30, 2024 | 103392.0 |
| October 31, 2024 | 100032.0 |
| September 30, 2024 | 97392.00 |
| August 31, 2024 | 102720.0 |
| July 31, 2024 | 108384.0 |
| June 30, 2024 | 110592.0 |
| May 31, 2024 | 109440.0 |
| April 30, 2024 | 105792.0 |
| Date | Value |
|---|---|
| March 31, 2024 | 100320.0 |
| February 29, 2024 | 97728.00 |
| January 31, 2024 | 95088.00 |
| December 31, 2023 | 97584.00 |
| November 30, 2023 | 105504.0 |
| October 31, 2023 | 108432.0 |
| September 30, 2023 | 104400.0 |
| August 31, 2023 | 106368.0 |
| July 31, 2023 | 104208.0 |
| June 30, 2023 | 103968.0 |
| May 31, 2023 | 97536.00 |
| April 30, 2023 | 93936.00 |
| March 31, 2023 | 93264.00 |
| February 28, 2023 | 87840.00 |
| January 31, 2023 | 87312.00 |
| December 31, 2022 | 89712.00 |
| November 30, 2022 | 95664.00 |
| October 31, 2022 | 98064.00 |
| September 30, 2022 | 91440.00 |
| August 31, 2022 | 84960.00 |
| July 31, 2022 | 88272.00 |
| June 30, 2022 | 92784.00 |
| May 31, 2022 | 88656.00 |
| April 30, 2022 | 83280.00 |
| March 31, 2022 | 72720.00 |
News
Headline
Time (ET)
05/19 15:28
05/15 07:05
05/07 12:00
Basic Info
|
US Qualifying Income is at a current level of 101520.0, up from 97824.00 last month and down from 104736.0 one year ago. This is a change of 3.78% from last month and -3.07% from one year ago. |
| Report | Monthly Report on Housing Affordability |
| Category | House Prices |
| Region | United States |
| Source | National Association of Realtors |
Stats
| Last Value | 101520.0 |
| Latest Period | Apr 2026 |
| Last Updated | May 11 2026, 11:03 EDT |
| Next Release | Jun 9 2026, 10:00 EDT |
| Average Growth Rate | 8.83% |
| Value from Last Month | 97824.00 |
| Change from Last Month | 3.78% |
| Value from 1 Year Ago | 104736.0 |
| Change from 1 Year Ago | -3.07% |
| Frequency | Monthly |
| Unit | USD |
| Adjustment | Not Seasonally Adjusted |
| Download Source File |