

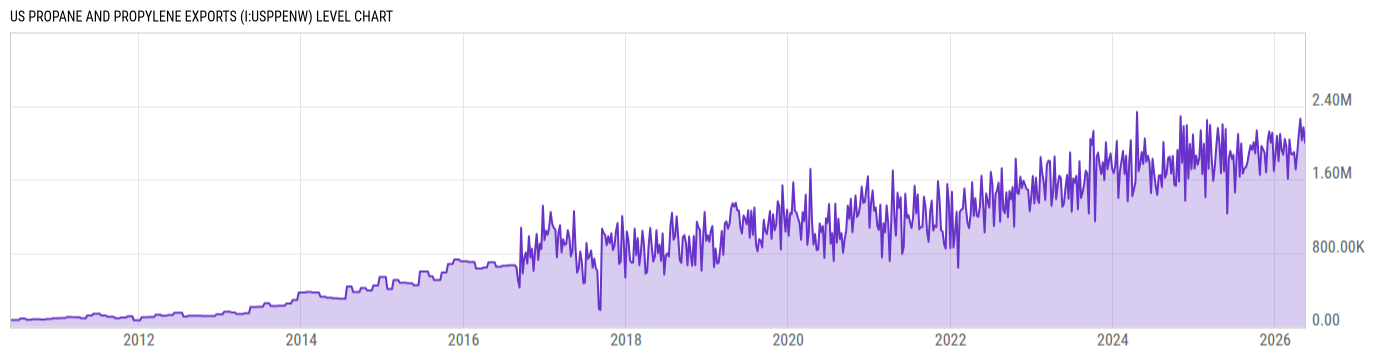
US Propane and Propylene Exports (I:USPPENW)
1.649M bbl/d for Wk of May 29 2026
Level Chart
Basic Info
|
US Propane and Propylene Exports is at a current level of 1.649M, down from 2.625M last week and down from 2.149M one year ago. This is a change of -37.18% from last week and -23.27% from one year ago. |
| Report | Weekly Petroleum Status |
| Category | Energy |
| Region | N/A |
| Source | Energy Information Administration |
Stats
| Last Value | 1.649M |
| Latest Period | May 29 2026 |
| Last Updated | Jun 5 2026, 09:25 EDT |
| Next Release | Jun 10 2026, 12:00 EDT |
| Average Growth Rate | 141.7% |
| Value from Last Week | 2.625M |
| Change from Last Week | -37.18% |
| Value from 1 Year Ago | 2.149M |
| Change from 1 Year Ago | -23.27% |
| Frequency | Weekly |
| Unit | Barrels per Day |
| Adjustment | N/A |
| Download Source File |
Historical Data
| Date | Value |
|---|---|
| May 29, 2026 | 1.649M |
| May 22, 2026 | 2.625M |
| May 15, 2026 | 2.001M |
| May 08, 2026 | 2.168M |
| May 01, 2026 | 2.028M |
| April 24, 2026 | 2.26M |
| April 17, 2026 | 2.09M |
| April 10, 2026 | 1.881M |
| April 03, 2026 | 1.711M |
| March 27, 2026 | 1.899M |
| March 20, 2026 | 1.872M |
| March 13, 2026 | 1.879M |
| March 06, 2026 | 2.035M |
| February 27, 2026 | 1.609M |
| February 20, 2026 | 1.962M |
| February 13, 2026 | 2.04M |
| February 06, 2026 | 1.871M |
| January 30, 2026 | 1.917M |
| January 23, 2026 | 2.095M |
| January 16, 2026 | 1.80M |
| January 09, 2026 | 2.076M |
| January 02, 2026 | 1.876M |
| December 26, 2025 | 1.692M |
| December 19, 2025 | 2.11M |
| December 12, 2025 | 2.002M |
| Date | Value |
|---|---|
| December 05, 2025 | 2.123M |
| November 28, 2025 | 2.019M |
| November 21, 2025 | 1.68M |
| November 14, 2025 | 1.894M |
| November 07, 2025 | 1.929M |
| October 31, 2025 | 1.964M |
| October 24, 2025 | 1.649M |
| October 17, 2025 | 1.892M |
| October 10, 2025 | 2.134M |
| October 03, 2025 | 1.885M |
| September 26, 2025 | 2.006M |
| September 19, 2025 | 1.922M |
| September 12, 2025 | 1.972M |
| September 05, 2025 | 1.891M |
| August 29, 2025 | 1.787M |
| August 22, 2025 | 1.732M |
| August 15, 2025 | 1.719M |
| August 08, 2025 | 1.664M |
| August 01, 2025 | 1.991M |
| July 25, 2025 | 1.629M |
| July 18, 2025 | 2.095M |
| July 11, 2025 | 1.837M |
| July 04, 2025 | 1.46M |
| June 27, 2025 | 1.868M |
| June 20, 2025 | 1.822M |
News
Headline
Time (ET)
06/01 14:42
05/27 06:13
05/21 14:40
05/20 16:03
05/13 14:39
Basic Info
|
US Propane and Propylene Exports is at a current level of 1.649M, down from 2.625M last week and down from 2.149M one year ago. This is a change of -37.18% from last week and -23.27% from one year ago. |
| Report | Weekly Petroleum Status |
| Category | Energy |
| Region | N/A |
| Source | Energy Information Administration |
Stats
| Last Value | 1.649M |
| Latest Period | May 29 2026 |
| Last Updated | Jun 5 2026, 09:25 EDT |
| Next Release | Jun 10 2026, 12:00 EDT |
| Average Growth Rate | 141.7% |
| Value from Last Week | 2.625M |
| Change from Last Week | -37.18% |
| Value from 1 Year Ago | 2.149M |
| Change from 1 Year Ago | -23.27% |
| Frequency | Weekly |
| Unit | Barrels per Day |
| Adjustment | N/A |
| Download Source File |