

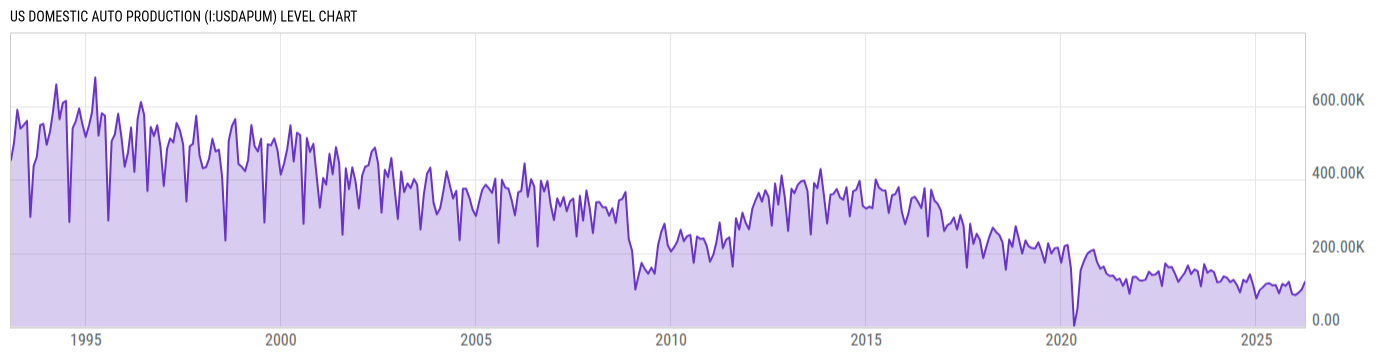
US Domestic Auto Production (I:USDAPUM)
121.55K for Mar 2026
Level Chart
Basic Info
|
US Domestic Auto Production is at a current level of 121.55K, up from 100.52K last month and up from 115.96K one year ago. This is a change of 20.92% from last month and 4.81% from one year ago. |
| Report | Supplemental Estimates |
| Category | Retail and Services Business Statistics |
| Region | United States |
| Source | Bureau of Economic Analysis |
Stats
| Last Value | 121.55K |
| Latest Period | Mar 2026 |
| Last Updated | May 3 2026, 18:17 EDT |
| Next Release | May 28 2026, 10:00 EDT |
| Average Growth Rate | 106.6% |
| Value from Last Month | 100.52K |
| Change from Last Month | 20.92% |
| Value from 1 Year Ago | 115.96K |
| Change from 1 Year Ago | 4.81% |
| Frequency | Monthly |
| Adjustment | Not Seasonally Adjusted |
| Download Source File |
Historical Data
| Date | Value |
|---|---|
| March 31, 2026 | 121.55K |
| February 28, 2026 | 100.52K |
| January 31, 2026 | 92.12K |
| December 31, 2025 | 85.28K |
| November 30, 2025 | 88.54K |
| October 31, 2025 | 121.56K |
| September 30, 2025 | 110.37K |
| August 31, 2025 | 115.89K |
| July 31, 2025 | 90.26K |
| June 30, 2025 | 112.91K |
| May 31, 2025 | 111.78K |
| April 30, 2025 | 117.73K |
| March 31, 2025 | 115.96K |
| February 28, 2025 | 106.47K |
| January 31, 2025 | 99.01K |
| December 31, 2024 | 76.46K |
| November 30, 2024 | 113.47K |
| October 31, 2024 | 142.03K |
| September 30, 2024 | 120.88K |
| August 31, 2024 | 126.98K |
| July 31, 2024 | 92.92K |
| June 30, 2024 | 113.70K |
| May 31, 2024 | 126.82K |
| April 30, 2024 | 120.59K |
| March 31, 2024 | 132.67K |
| Date | Value |
|---|---|
| February 29, 2024 | 136.37K |
| January 31, 2024 | 122.16K |
| December 31, 2023 | 120.22K |
| November 30, 2023 | 148.07K |
| October 31, 2023 | 153.24K |
| September 30, 2023 | 146.13K |
| August 31, 2023 | 169.71K |
| July 31, 2023 | 109.21K |
| June 30, 2023 | 150.87K |
| May 31, 2023 | 155.06K |
| April 30, 2023 | 142.43K |
| March 31, 2023 | 165.97K |
| February 28, 2023 | 145.50K |
| January 31, 2023 | 134.67K |
| December 31, 2022 | 121.46K |
| November 30, 2022 | 143.83K |
| October 31, 2022 | 161.95K |
| September 30, 2022 | 161.07K |
| August 31, 2022 | 171.60K |
| July 31, 2022 | 110.17K |
| June 30, 2022 | 150.28K |
| May 31, 2022 | 141.62K |
| April 30, 2022 | 140.15K |
| March 31, 2022 | 149.19K |
| February 28, 2022 | 127.51K |
News
Headline
Time (ET)
05/12 07:21
04/24 07:42
04/23 08:36
Basic Info
|
US Domestic Auto Production is at a current level of 121.55K, up from 100.52K last month and up from 115.96K one year ago. This is a change of 20.92% from last month and 4.81% from one year ago. |
| Report | Supplemental Estimates |
| Category | Retail and Services Business Statistics |
| Region | United States |
| Source | Bureau of Economic Analysis |
Stats
| Last Value | 121.55K |
| Latest Period | Mar 2026 |
| Last Updated | May 3 2026, 18:17 EDT |
| Next Release | May 28 2026, 10:00 EDT |
| Average Growth Rate | 106.6% |
| Value from Last Month | 100.52K |
| Change from Last Month | 20.92% |
| Value from 1 Year Ago | 115.96K |
| Change from 1 Year Ago | 4.81% |
| Frequency | Monthly |
| Adjustment | Not Seasonally Adjusted |
| Download Source File |