

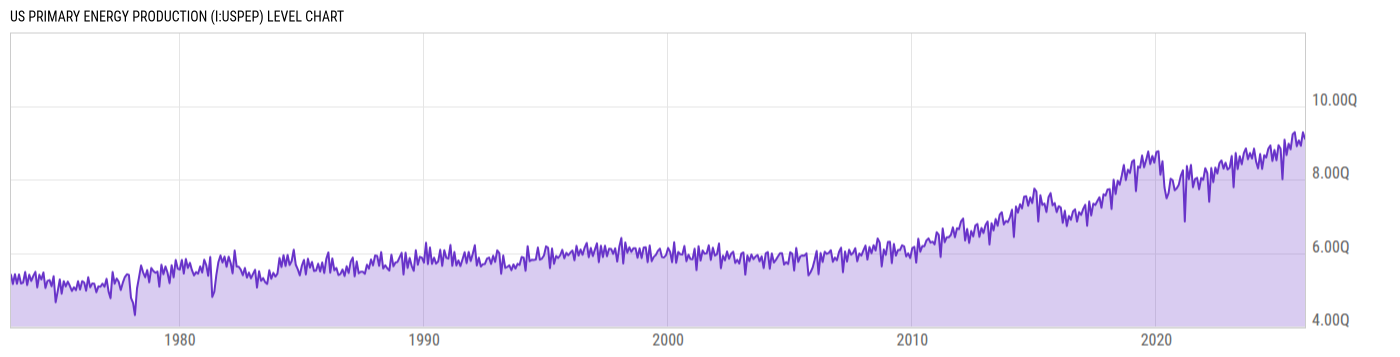
US Primary Energy Production (I:USPEP)
9.108Q Btu for Jan 2026
Level Chart
Basic Info
|
US Primary Energy Production is at a current level of 9.108Q, down from 9.284Q last month and up from 8.836Q one year ago. This is a change of -1.90% from last month and 3.07% from one year ago. |
| Report | Monthly Energy Review |
| Category | Energy |
| Region | United States |
| Source | Energy Information Administration |
Stats
| Last Value | 9.108Q |
| Latest Period | Jan 2026 |
| Last Updated | Apr 27 2026, 18:16 EDT |
| Next Release | May 26 2026, 14:00 EDT |
| Average Growth Rate | 2.57% |
| Value from Last Month | 9.284Q |
| Change from Last Month | -1.90% |
| Value from 1 Year Ago | 8.836Q |
| Change from 1 Year Ago | 3.07% |
| Frequency | Monthly |
| Unit | British thermal units |
| Adjustment | N/A |
| Download Source File |
Historical Data
| Date | Value |
|---|---|
| January 31, 2026 | 9.108Q |
| December 31, 2025 | 9.284Q |
| November 30, 2025 | 8.918Q |
| October 31, 2025 | 9.063Q |
| September 30, 2025 | 8.906Q |
| August 31, 2025 | 9.288Q |
| July 31, 2025 | 9.234Q |
| June 30, 2025 | 8.822Q |
| May 31, 2025 | 8.974Q |
| April 30, 2025 | 8.666Q |
| March 31, 2025 | 9.085Q |
| February 28, 2025 | 8.007Q |
| January 31, 2025 | 8.836Q |
| December 31, 2024 | 8.934Q |
| November 30, 2024 | 8.524Q |
| October 31, 2024 | 8.801Q |
| September 30, 2024 | 8.505Q |
| August 31, 2024 | 8.927Q |
| July 31, 2024 | 8.836Q |
| June 30, 2024 | 8.599Q |
| May 31, 2024 | 8.660Q |
| April 30, 2024 | 8.288Q |
| March 31, 2024 | 8.692Q |
| February 29, 2024 | 8.303Q |
| January 31, 2024 | 8.482Q |
| Date | Value |
|---|---|
| December 31, 2023 | 8.840Q |
| November 30, 2023 | 8.572Q |
| October 31, 2023 | 8.719Q |
| September 30, 2023 | 8.550Q |
| August 31, 2023 | 8.845Q |
| July 31, 2023 | 8.716Q |
| June 30, 2023 | 8.412Q |
| May 31, 2023 | 8.634Q |
| April 30, 2023 | 8.285Q |
| March 31, 2023 | 8.722Q |
| February 28, 2023 | 7.791Q |
| January 31, 2023 | 8.639Q |
| December 31, 2022 | 8.320Q |
| November 30, 2022 | 8.274Q |
| October 31, 2022 | 8.458Q |
| September 30, 2022 | 8.296Q |
| August 31, 2022 | 8.517Q |
| July 31, 2022 | 8.446Q |
| June 30, 2022 | 8.162Q |
| May 31, 2022 | 8.323Q |
| April 30, 2022 | 7.928Q |
| March 31, 2022 | 8.312Q |
| February 28, 2022 | 7.396Q |
| January 31, 2022 | 8.171Q |
| December 31, 2021 | 8.306Q |
News
Headline
Time (ET)
05/12 15:59
Basic Info
|
US Primary Energy Production is at a current level of 9.108Q, down from 9.284Q last month and up from 8.836Q one year ago. This is a change of -1.90% from last month and 3.07% from one year ago. |
| Report | Monthly Energy Review |
| Category | Energy |
| Region | United States |
| Source | Energy Information Administration |
Stats
| Last Value | 9.108Q |
| Latest Period | Jan 2026 |
| Last Updated | Apr 27 2026, 18:16 EDT |
| Next Release | May 26 2026, 14:00 EDT |
| Average Growth Rate | 2.57% |
| Value from Last Month | 9.284Q |
| Change from Last Month | -1.90% |
| Value from 1 Year Ago | 8.836Q |
| Change from 1 Year Ago | 3.07% |
| Frequency | Monthly |
| Unit | British thermal units |
| Adjustment | N/A |
| Download Source File |