

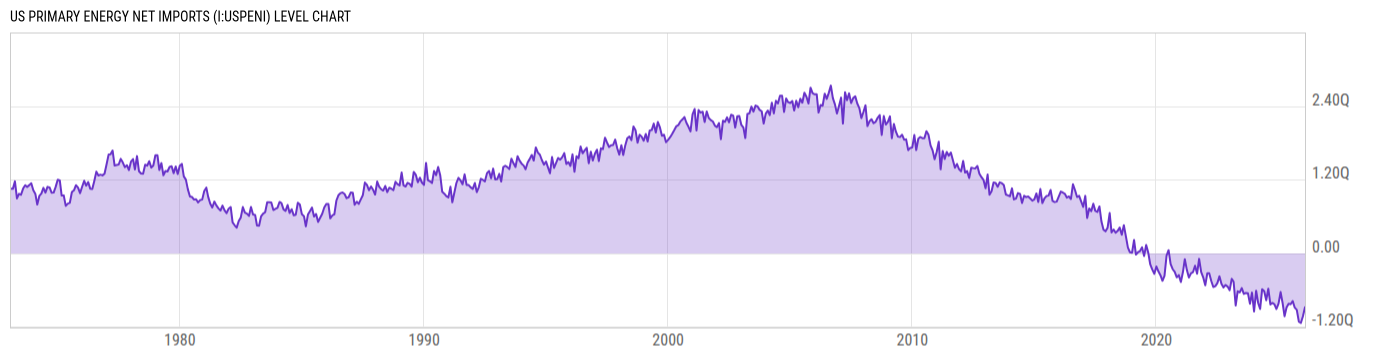
US Primary Energy Net Imports (I:USPENI)
-0.8860Q Btu for Jan 2026
Level Chart
Basic Info
|
US Primary Energy Net Imports is at a current level of -0.8860Q, up from -1.032Q last month and down from -0.6385Q one year ago. This is a change of N/A from last month. |
| Report | Monthly Energy Review |
| Category | Energy |
| Region | United States |
| Source | Energy Information Administration |
Stats
| Last Value | -0.8860Q |
| Latest Period | Jan 2026 |
| Last Updated | Apr 27 2026, 18:17 EDT |
| Next Release | May 26 2026, 14:00 EDT |
| Average Growth Rate | 62.37% |
| Value from Last Month | -1.032Q |
| Change from Last Month | N/A |
| Value from 1 Year Ago | -0.6385Q |
| Change from 1 Year Ago | N/A |
| Frequency | Monthly |
| Unit | British thermal units |
| Adjustment | N/A |
| Download Source File |
Historical Data
| Date | Value |
|---|---|
| January 31, 2026 | -0.886Q |
| December 31, 2025 | -1.032Q |
| November 30, 2025 | -1.143Q |
| October 31, 2025 | -1.122Q |
| September 30, 2025 | -0.9296Q |
| August 31, 2025 | -0.8931Q |
| July 31, 2025 | -0.7865Q |
| June 30, 2025 | -0.8371Q |
| May 31, 2025 | -0.8286Q |
| April 30, 2025 | -0.8892Q |
| March 31, 2025 | -1.032Q |
| February 28, 2025 | -0.8035Q |
| January 31, 2025 | -0.6385Q |
| December 31, 2024 | -0.8264Q |
| November 30, 2024 | -0.9145Q |
| October 31, 2024 | -0.8387Q |
| September 30, 2024 | -0.8148Q |
| August 31, 2024 | -0.8402Q |
| July 31, 2024 | -0.583Q |
| June 30, 2024 | -0.7713Q |
| May 31, 2024 | -0.6252Q |
| April 30, 2024 | -0.5914Q |
| March 31, 2024 | -0.9139Q |
| February 29, 2024 | -0.8113Q |
| January 31, 2024 | -0.6168Q |
| Date | Value |
|---|---|
| December 31, 2023 | -0.9542Q |
| November 30, 2023 | -0.6471Q |
| October 31, 2023 | -0.83Q |
| September 30, 2023 | -0.6557Q |
| August 31, 2023 | -0.6523Q |
| July 31, 2023 | -0.6683Q |
| June 30, 2023 | -0.5725Q |
| May 31, 2023 | -0.6433Q |
| April 30, 2023 | -0.6257Q |
| March 31, 2023 | -0.8575Q |
| February 28, 2023 | -0.4697Q |
| January 31, 2023 | -0.4223Q |
| December 31, 2022 | -0.6065Q |
| November 30, 2022 | -0.5488Q |
| October 31, 2022 | -0.523Q |
| September 30, 2022 | -0.5612Q |
| August 31, 2022 | -0.5052Q |
| July 31, 2022 | -0.3811Q |
| June 30, 2022 | -0.4915Q |
| May 31, 2022 | -0.54Q |
| April 30, 2022 | -0.5553Q |
| March 31, 2022 | -0.4573Q |
| February 28, 2022 | -0.3298Q |
| January 31, 2022 | -0.3293Q |
| December 31, 2021 | -0.5272Q |
News
Headline
Time (ET)
05/22 15:56
05/12 15:59
Basic Info
|
US Primary Energy Net Imports is at a current level of -0.8860Q, up from -1.032Q last month and down from -0.6385Q one year ago. This is a change of N/A from last month. |
| Report | Monthly Energy Review |
| Category | Energy |
| Region | United States |
| Source | Energy Information Administration |
Stats
| Last Value | -0.8860Q |
| Latest Period | Jan 2026 |
| Last Updated | Apr 27 2026, 18:17 EDT |
| Next Release | May 26 2026, 14:00 EDT |
| Average Growth Rate | 62.37% |
| Value from Last Month | -1.032Q |
| Change from Last Month | N/A |
| Value from 1 Year Ago | -0.6385Q |
| Change from 1 Year Ago | N/A |
| Frequency | Monthly |
| Unit | British thermal units |
| Adjustment | N/A |
| Download Source File |