

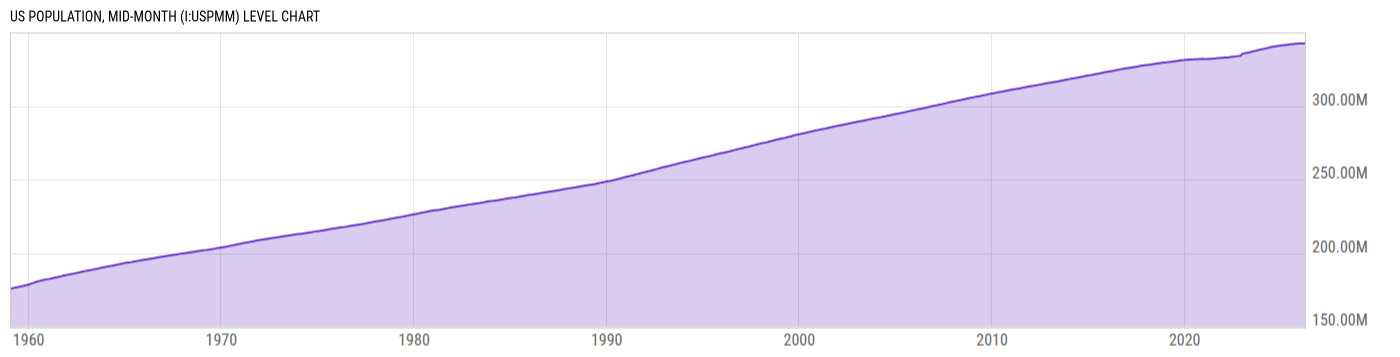
US Population, Mid-Month (I:USPMM)
342.63M for Mar 2026
Level Chart
Basic Info
|
US Population, Mid-Month is at a current level of 342.63M, up from 342.58M last month and up from 341.50M one year ago. This is a change of 0.01% from last month and 0.33% from one year ago. |
| Report | Personal Income and Outlays |
| Category | Consumer & Household Statistics |
| Region | United States |
| Source | Bureau of Economic Analysis |
Stats
| Last Value | 342.63M |
| Latest Period | Mar 2026 |
| Last Updated | Apr 30 2026, 11:59 EDT |
| Next Release | May 28 2026, 08:30 EDT |
| Average Growth Rate | 0.99% |
| Value from Last Month | 342.58M |
| Change from Last Month | 0.01% |
| Value from 1 Year Ago | 341.50M |
| Change from 1 Year Ago | 0.33% |
| Frequency | Monthly |
| Adjustment | N/A |
Historical Data
| Date | Value |
|---|---|
| March 31, 2026 | 342.63M |
| February 28, 2026 | 342.58M |
| January 31, 2026 | 342.54M |
| December 31, 2025 | 342.50M |
| November 30, 2025 | 342.44M |
| October 31, 2025 | 342.37M |
| September 30, 2025 | 342.28M |
| August 31, 2025 | 342.18M |
| July 31, 2025 | 342.08M |
| June 30, 2025 | 341.94M |
| May 31, 2025 | 341.78M |
| April 30, 2025 | 341.63M |
| March 31, 2025 | 341.50M |
| February 28, 2025 | 341.38M |
| January 31, 2025 | 341.27M |
| December 31, 2024 | 341.15M |
| November 30, 2024 | 341.01M |
| October 31, 2024 | 340.86M |
| September 30, 2024 | 340.69M |
| August 31, 2024 | 340.51M |
| July 31, 2024 | 340.34M |
| June 30, 2024 | 340.11M |
| May 31, 2024 | 339.83M |
| April 30, 2024 | 339.55M |
| March 31, 2024 | 339.29M |
| Date | Value |
|---|---|
| February 29, 2024 | 339.03M |
| January 31, 2024 | 338.79M |
| December 31, 2023 | 338.55M |
| November 30, 2023 | 338.37M |
| October 31, 2023 | 338.09M |
| September 30, 2023 | 337.80M |
| August 31, 2023 | 337.50M |
| July 31, 2023 | 337.20M |
| June 30, 2023 | 336.92M |
| May 31, 2023 | 336.68M |
| April 30, 2023 | 336.45M |
| March 31, 2023 | 336.23M |
| February 28, 2023 | 336.02M |
| January 31, 2023 | 335.81M |
| December 31, 2022 | 335.60M |
| November 30, 2022 | 334.21M |
| October 31, 2022 | 334.07M |
| September 30, 2022 | 333.92M |
| August 31, 2022 | 333.76M |
| July 31, 2022 | 333.60M |
| June 30, 2022 | 333.45M |
| May 31, 2022 | 333.32M |
| April 30, 2022 | 333.19M |
| March 31, 2022 | 333.07M |
| February 28, 2022 | 332.97M |
News
Headline
Time (ET)
04/30 13:32
04/30 07:48
Basic Info
|
US Population, Mid-Month is at a current level of 342.63M, up from 342.58M last month and up from 341.50M one year ago. This is a change of 0.01% from last month and 0.33% from one year ago. |
| Report | Personal Income and Outlays |
| Category | Consumer & Household Statistics |
| Region | United States |
| Source | Bureau of Economic Analysis |
Stats
| Last Value | 342.63M |
| Latest Period | Mar 2026 |
| Last Updated | Apr 30 2026, 11:59 EDT |
| Next Release | May 28 2026, 08:30 EDT |
| Average Growth Rate | 0.99% |
| Value from Last Month | 342.58M |
| Change from Last Month | 0.01% |
| Value from 1 Year Ago | 341.50M |
| Change from 1 Year Ago | 0.33% |
| Frequency | Monthly |
| Adjustment | N/A |