

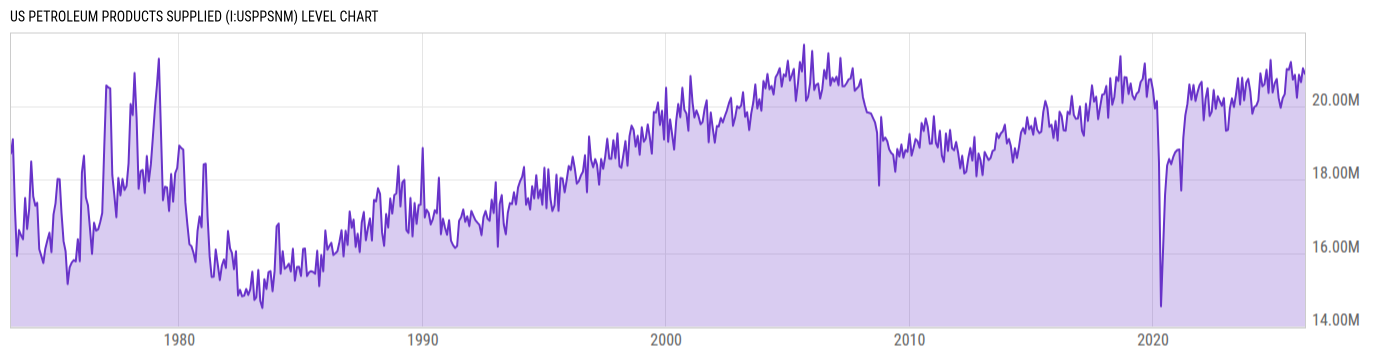
US Petroleum Products Supplied (I:USPPSNM)
20.88M bbl/d for Mar 2026
Level Chart
Basic Info
|
US Petroleum Products Supplied is at a current level of 20.88M, down from 21.03M last month and up from 19.95M one year ago. This is a change of -0.72% from last month and 4.64% from one year ago. |
| Report | Monthly Energy Review |
| Category | Energy |
| Region | United States |
| Source | Energy Information Administration |
Stats
| Last Value | 20.88M |
| Latest Period | Mar 2026 |
| Last Updated | Apr 27 2026, 18:17 EDT |
| Next Release | May 26 2026, 14:00 EDT |
| Average Growth Rate | 0.93% |
| Value from Last Month | 21.03M |
| Change from Last Month | -0.72% |
| Value from 1 Year Ago | 19.95M |
| Change from 1 Year Ago | 4.64% |
| Frequency | Monthly |
| Unit | Barrels per Day |
| Adjustment | N/A |
| Download Source File |
Historical Data
| Date | Value |
|---|---|
| March 31, 2026 | 20.88M |
| February 28, 2026 | 21.03M |
| January 31, 2026 | 20.65M |
| December 31, 2025 | 20.85M |
| November 30, 2025 | 20.23M |
| October 31, 2025 | 20.85M |
| September 30, 2025 | 20.72M |
| August 31, 2025 | 21.20M |
| July 31, 2025 | 20.98M |
| June 30, 2025 | 21.01M |
| May 31, 2025 | 20.32M |
| April 30, 2025 | 20.21M |
| March 31, 2025 | 19.95M |
| February 28, 2025 | 20.23M |
| January 31, 2025 | 20.74M |
| December 31, 2024 | 20.62M |
| November 30, 2024 | 20.37M |
| October 31, 2024 | 21.25M |
| September 30, 2024 | 20.36M |
| August 31, 2024 | 20.98M |
| July 31, 2024 | 20.59M |
| June 30, 2024 | 20.54M |
| May 31, 2024 | 20.89M |
| April 30, 2024 | 20.16M |
| March 31, 2024 | 20.01M |
| Date | Value |
|---|---|
| February 29, 2024 | 19.97M |
| January 31, 2024 | 19.79M |
| December 31, 2023 | 20.40M |
| November 30, 2023 | 20.74M |
| October 31, 2023 | 20.63M |
| September 30, 2023 | 20.15M |
| August 31, 2023 | 20.77M |
| July 31, 2023 | 20.04M |
| June 30, 2023 | 20.76M |
| May 31, 2023 | 20.32M |
| April 30, 2023 | 19.97M |
| March 31, 2023 | 20.21M |
| February 28, 2023 | 19.94M |
| January 31, 2023 | 19.35M |
| December 31, 2022 | 19.33M |
| November 30, 2022 | 20.21M |
| October 31, 2022 | 20.01M |
| September 30, 2022 | 20.13M |
| August 31, 2022 | 20.27M |
| July 31, 2022 | 19.93M |
| June 30, 2022 | 20.43M |
| May 31, 2022 | 19.84M |
| April 30, 2022 | 19.73M |
| March 31, 2022 | 20.48M |
| February 28, 2022 | 20.19M |
News
Headline
Time (ET)
05/12 15:59
Basic Info
|
US Petroleum Products Supplied is at a current level of 20.88M, down from 21.03M last month and up from 19.95M one year ago. This is a change of -0.72% from last month and 4.64% from one year ago. |
| Report | Monthly Energy Review |
| Category | Energy |
| Region | United States |
| Source | Energy Information Administration |
Stats
| Last Value | 20.88M |
| Latest Period | Mar 2026 |
| Last Updated | Apr 27 2026, 18:17 EDT |
| Next Release | May 26 2026, 14:00 EDT |
| Average Growth Rate | 0.93% |
| Value from Last Month | 21.03M |
| Change from Last Month | -0.72% |
| Value from 1 Year Ago | 19.95M |
| Change from 1 Year Ago | 4.64% |
| Frequency | Monthly |
| Unit | Barrels per Day |
| Adjustment | N/A |
| Download Source File |