

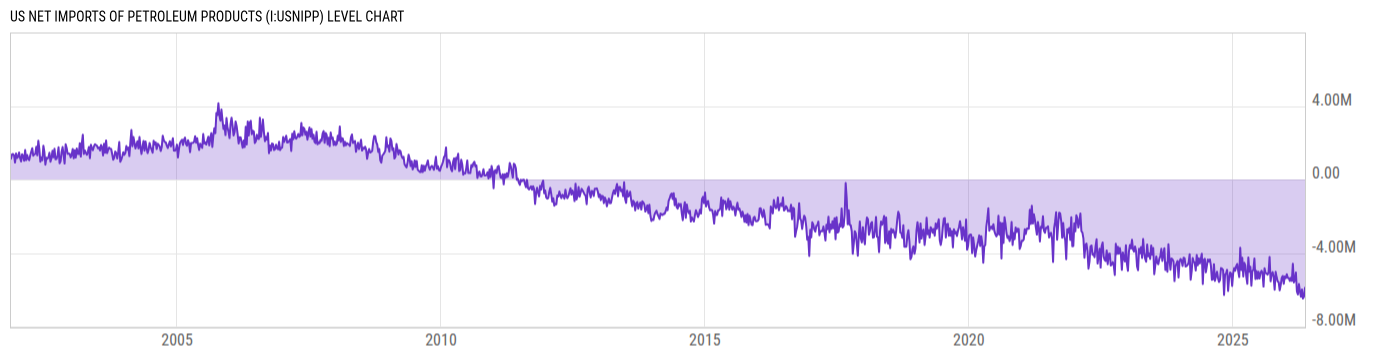
US Net Imports of Petroleum Products (I:USNIPP)
-5.894M bbl/d for Wk of May 15 2026
Level Chart
Basic Info
|
US Net Imports of Petroleum Products is at a current level of -5.894M, up from -6.376M last week and down from -5.776M one year ago. This is a change of N/A from last week. |
| Report | Weekly Petroleum Status |
| Category | Energy |
| Region | N/A |
| Source | Energy Information Administration |
Stats
| Last Value | -5.894M |
| Latest Period | May 15 2026 |
| Last Updated | May 20 2026, 12:04 EDT |
| Next Release | May 28 2026, 12:00 EDT |
| Average Growth Rate | 460.3% |
| Value from Last Week | -6.376M |
| Change from Last Week | N/A |
| Value from 1 Year Ago | -5.776M |
| Change from 1 Year Ago | N/A |
| Frequency | Weekly |
| Unit | Barrels per Day |
| Adjustment | N/A |
| Download Source File |
Historical Data
| Date | Value |
|---|---|
| May 15, 2026 | -5.894M |
| May 08, 2026 | -6.376M |
| May 01, 2026 | -6.481M |
| April 24, 2026 | -5.989M |
| April 17, 2026 | -6.383M |
| April 10, 2026 | -6.09M |
| April 03, 2026 | -5.693M |
| March 27, 2026 | -6.256M |
| March 20, 2026 | -6.095M |
| March 13, 2026 | -5.062M |
| March 06, 2026 | -5.46M |
| February 27, 2026 | -5.604M |
| February 20, 2026 | -4.587M |
| February 13, 2026 | -5.517M |
| February 06, 2026 | -5.354M |
| January 30, 2026 | -5.52M |
| January 23, 2026 | -5.359M |
| January 16, 2026 | -5.361M |
| January 09, 2026 | -5.16M |
| January 02, 2026 | -5.368M |
| December 26, 2025 | -5.285M |
| December 19, 2025 | -5.679M |
| December 12, 2025 | -5.249M |
| December 05, 2025 | -5.359M |
| November 28, 2025 | -5.75M |
| Date | Value |
|---|---|
| November 21, 2025 | -6.033M |
| November 14, 2025 | -5.598M |
| November 07, 2025 | -5.548M |
| October 31, 2025 | -5.325M |
| October 24, 2025 | -5.026M |
| October 17, 2025 | -5.997M |
| October 10, 2025 | -5.309M |
| October 03, 2025 | -5.042M |
| September 26, 2025 | -5.149M |
| September 19, 2025 | -5.539M |
| September 12, 2025 | -4.212M |
| September 05, 2025 | -5.048M |
| August 29, 2025 | -5.178M |
| August 22, 2025 | -5.107M |
| August 15, 2025 | -5.091M |
| August 08, 2025 | -4.833M |
| August 01, 2025 | -5.829M |
| July 25, 2025 | -5.089M |
| July 18, 2025 | -4.967M |
| July 11, 2025 | -5.109M |
| July 04, 2025 | -5.388M |
| June 27, 2025 | -5.017M |
| June 20, 2025 | -5.397M |
| June 13, 2025 | -4.984M |
| June 06, 2025 | -5.415M |
News
Headline
Time (ET)
05/21 14:40
05/20 16:03
05/13 14:39
Basic Info
|
US Net Imports of Petroleum Products is at a current level of -5.894M, up from -6.376M last week and down from -5.776M one year ago. This is a change of N/A from last week. |
| Report | Weekly Petroleum Status |
| Category | Energy |
| Region | N/A |
| Source | Energy Information Administration |
Stats
| Last Value | -5.894M |
| Latest Period | May 15 2026 |
| Last Updated | May 20 2026, 12:04 EDT |
| Next Release | May 28 2026, 12:00 EDT |
| Average Growth Rate | 460.3% |
| Value from Last Week | -6.376M |
| Change from Last Week | N/A |
| Value from 1 Year Ago | -5.776M |
| Change from 1 Year Ago | N/A |
| Frequency | Weekly |
| Unit | Barrels per Day |
| Adjustment | N/A |
| Download Source File |