

US People Fully Vaccinated for Coronavirus (I:USPFVC)
230.64M for May 09 2023
Level Chart
Basic Info
|
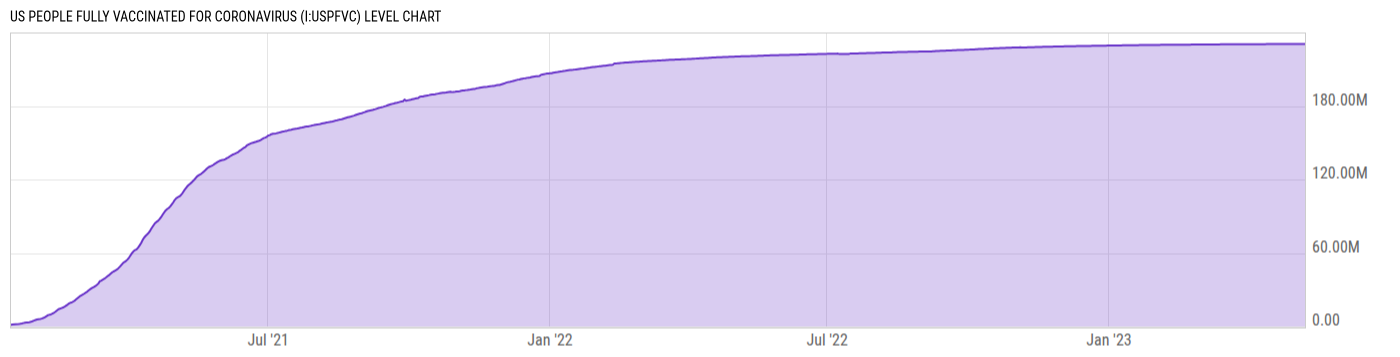
US People Fully Vaccinated for Coronavirus is at a current level of 230.64M, up from 230.64M yesterday and up from 220.62M one year ago. This is a change of 0.00% from yesterday and 4.54% from one year ago. |
| Report | Coronavirus (COVID-19) Vaccinations |
| Category | Public Health |
| Region | United States |
| Source | Our World in Data |
Stats
| Last Value | 230.64M |
| Latest Period | May 09 2023 |
| Last Updated | May 14 2023, 20:00 EDT |
| Next Release | May 23 2026, 18:00 EDT (E) |
| Average Growth Rate | 231.6% |
| Value from Yesterday | 230.64M |
| Change from Yesterday | 0.00% |
| Value from 1 Year Ago | 220.62M |
| Change from 1 Year Ago | 4.54% |
| Frequency | Daily |
| Adjustment | N/A |
| Download Source File | |
| Notes | Includes any person that has received at least a full recommended course of Coronavirus vaccine, which may be 1 or 2 doses depending on exact vaccine received. |
Historical Data
| Date | Value |
|---|---|
| May 09, 2023 | 230.64M |
| May 08, 2023 | 230.64M |
| May 07, 2023 | 230.63M |
| May 06, 2023 | 230.63M |
| May 05, 2023 | 230.63M |
| May 04, 2023 | 230.62M |
| May 03, 2023 | 230.62M |
| May 02, 2023 | 230.61M |
| May 01, 2023 | 230.61M |
| April 30, 2023 | 230.60M |
| April 29, 2023 | 230.60M |
| April 28, 2023 | 230.60M |
| April 27, 2023 | 230.59M |
| April 26, 2023 | 230.59M |
| April 25, 2023 | 230.58M |
| April 24, 2023 | 230.57M |
| April 23, 2023 | 230.57M |
| April 22, 2023 | 230.57M |
| April 21, 2023 | 230.56M |
| April 20, 2023 | 230.56M |
| April 19, 2023 | 230.55M |
| April 18, 2023 | 230.55M |
| April 17, 2023 | 230.54M |
| April 16, 2023 | 230.54M |
| April 15, 2023 | 230.54M |
| Date | Value |
|---|---|
| April 14, 2023 | 230.52M |
| April 13, 2023 | 230.51M |
| April 12, 2023 | 230.50M |
| April 11, 2023 | 230.50M |
| April 10, 2023 | 230.49M |
| April 09, 2023 | 230.48M |
| April 08, 2023 | 230.48M |
| April 07, 2023 | 230.46M |
| April 06, 2023 | 230.45M |
| April 05, 2023 | 230.45M |
| April 04, 2023 | 230.44M |
| April 03, 2023 | 230.43M |
| April 02, 2023 | 230.43M |
| April 01, 2023 | 230.43M |
| March 31, 2023 | 230.41M |
| March 30, 2023 | 230.40M |
| March 29, 2023 | 230.39M |
| March 28, 2023 | 230.38M |
| March 27, 2023 | 230.37M |
| March 26, 2023 | 230.37M |
| March 25, 2023 | 230.37M |
| March 24, 2023 | 230.39M |
| March 23, 2023 | 230.38M |
| March 22, 2023 | 230.37M |
| March 21, 2023 | 230.36M |
News
Headline
Time (ET)
04/28 11:03
Basic Info
|
US People Fully Vaccinated for Coronavirus is at a current level of 230.64M, up from 230.64M yesterday and up from 220.62M one year ago. This is a change of 0.00% from yesterday and 4.54% from one year ago. |
| Report | Coronavirus (COVID-19) Vaccinations |
| Category | Public Health |
| Region | United States |
| Source | Our World in Data |
Stats
| Last Value | 230.64M |
| Latest Period | May 09 2023 |
| Last Updated | May 14 2023, 20:00 EDT |
| Next Release | May 23 2026, 18:00 EDT (E) |
| Average Growth Rate | 231.6% |
| Value from Yesterday | 230.64M |
| Change from Yesterday | 0.00% |
| Value from 1 Year Ago | 220.62M |
| Change from 1 Year Ago | 4.54% |
| Frequency | Daily |
| Adjustment | N/A |
| Download Source File | |
| Notes | Includes any person that has received at least a full recommended course of Coronavirus vaccine, which may be 1 or 2 doses depending on exact vaccine received. |