

US Pentanes Plus Product Supplied (I:USPPPS)
6.593M bbl for Mar 2022
Level Chart
Basic Info
|
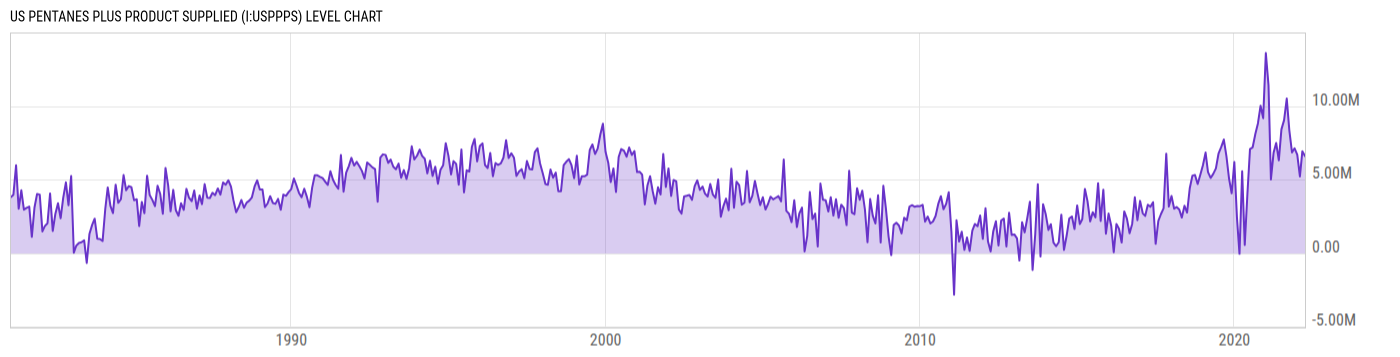
US Pentanes Plus Product Supplied is at a current level of 6.593M, down from 6.914M last month and down from 6.82M one year ago. This is a change of -4.64% from last month and -3.33% from one year ago. |
| Report | US Petroleum Product Supplied |
| Category | Energy |
| Region | United States |
| Source | Energy Information Administration |
Stats
| Last Value | 6.593M |
| Latest Period | Mar 2022 |
| Last Updated | May 31 2022, 15:31 EDT |
| Next Release | May 29 2026, 15:30 EDT |
| Average Growth Rate | 26.54% |
| Value from Last Month | 6.914M |
| Change from Last Month | -4.64% |
| Value from 1 Year Ago | 6.82M |
| Change from 1 Year Ago | -3.33% |
| Frequency | Monthly |
| Unit | Barrels |
| Adjustment | N/A |
| Download Source File |
Historical Data
| Date | Value |
|---|---|
| March 31, 2022 | 6.593M |
| February 28, 2022 | 6.914M |
| January 31, 2022 | 5.207M |
| December 31, 2021 | 6.692M |
| November 30, 2021 | 7.121M |
| October 31, 2021 | 6.841M |
| September 30, 2021 | 8.343M |
| August 31, 2021 | 10.50M |
| July 31, 2021 | 9.039M |
| June 30, 2021 | 8.411M |
| May 31, 2021 | 6.304M |
| April 30, 2021 | 7.487M |
| March 31, 2021 | 6.82M |
| February 28, 2021 | 5.004M |
| January 31, 2021 | 11.42M |
| December 31, 2020 | 13.60M |
| November 30, 2020 | 9.173M |
| October 31, 2020 | 10.02M |
| September 30, 2020 | 8.815M |
| August 31, 2020 | 8.10M |
| July 31, 2020 | 7.19M |
| June 30, 2020 | 7.068M |
| May 31, 2020 | 4.027M |
| April 30, 2020 | 550.00K |
| March 31, 2020 | 5.553M |
| Date | Value |
|---|---|
| February 29, 2020 | -58.00K |
| January 31, 2020 | 2.358M |
| December 31, 2019 | 6.191M |
| November 30, 2019 | 4.059M |
| October 31, 2019 | 5.05M |
| September 30, 2019 | 6.591M |
| August 31, 2019 | 7.717M |
| July 31, 2019 | 7.202M |
| June 30, 2019 | 6.752M |
| May 31, 2019 | 5.753M |
| April 30, 2019 | 5.381M |
| March 31, 2019 | 5.106M |
| February 28, 2019 | 5.501M |
| January 31, 2019 | 6.831M |
| December 31, 2018 | 5.964M |
| November 30, 2018 | 5.31M |
| October 31, 2018 | 4.699M |
| September 30, 2018 | 5.308M |
| August 31, 2018 | 5.263M |
| July 31, 2018 | 4.402M |
| June 30, 2018 | 2.749M |
| May 31, 2018 | 3.214M |
| April 30, 2018 | 2.41M |
| March 31, 2018 | 2.957M |
| February 28, 2018 | 3.127M |
News
Headline
Time (ET)
05/20 16:03
05/05 05:55
04/28 05:55
Basic Info
|
US Pentanes Plus Product Supplied is at a current level of 6.593M, down from 6.914M last month and down from 6.82M one year ago. This is a change of -4.64% from last month and -3.33% from one year ago. |
| Report | US Petroleum Product Supplied |
| Category | Energy |
| Region | United States |
| Source | Energy Information Administration |
Stats
| Last Value | 6.593M |
| Latest Period | Mar 2022 |
| Last Updated | May 31 2022, 15:31 EDT |
| Next Release | May 29 2026, 15:30 EDT |
| Average Growth Rate | 26.54% |
| Value from Last Month | 6.914M |
| Change from Last Month | -4.64% |
| Value from 1 Year Ago | 6.82M |
| Change from 1 Year Ago | -3.33% |
| Frequency | Monthly |
| Unit | Barrels |
| Adjustment | N/A |
| Download Source File |