

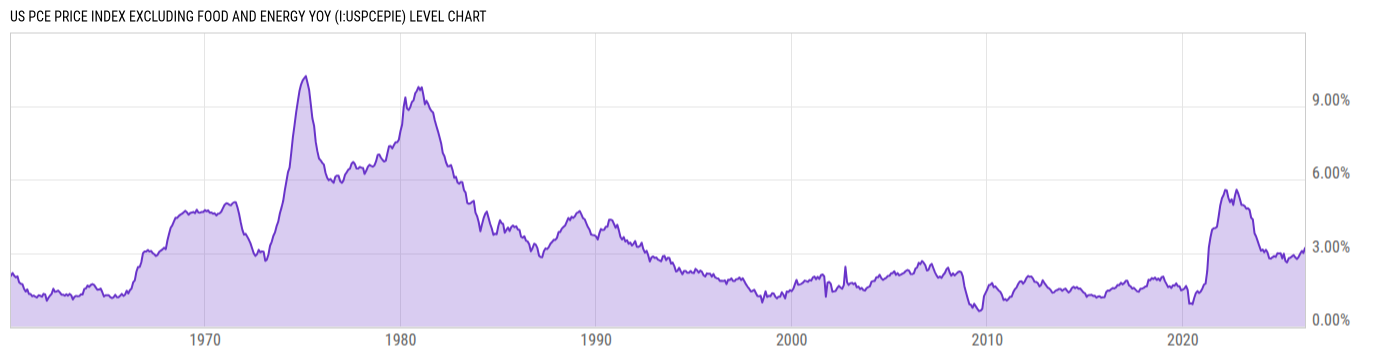
US PCE Price Index Excluding Food and Energy YoY (I:USPCEPIE)
3.20% for Mar 2026
Level Chart
Basic Info
|
US PCE Price Index Excluding Food and Energy YoY is at 3.20%, compared to 3.00% last month and 2.67% last year. This is lower than the long term average of 3.23%. |
| Report | Personal Income and Outlays |
| Category | Consumer & Household Statistics |
| Region | United States |
| Source | Bureau of Economic Analysis |
Stats
| Last Value | 3.20% |
| Latest Period | Mar 2026 |
| Last Updated | Apr 30 2026, 11:58 EDT |
| Next Release | May 28 2026, 08:30 EDT |
| Long Term Average | 3.23% |
| Average Growth Rate | 3.71% |
| Value from Last Month | 3.00% |
| Change from Last Month | 6.71% |
| Value from 1 Year Ago | 2.67% |
| Change from 1 Year Ago | 19.94% |
| Frequency | Monthly |
| Unit | Percent |
| Adjustment | Seasonally Adjusted |
| Download Source File |
Historical Data
| Date | Value |
|---|---|
| March 31, 2026 | 3.20% |
| February 28, 2026 | 3.00% |
| January 31, 2026 | 3.08% |
| December 31, 2025 | 2.97% |
| November 30, 2025 | 2.83% |
| October 31, 2025 | 2.75% |
| September 30, 2025 | 2.83% |
| August 31, 2025 | 2.91% |
| July 31, 2025 | 2.86% |
| June 30, 2025 | 2.81% |
| May 31, 2025 | 2.78% |
| April 30, 2025 | 2.61% |
| March 31, 2025 | 2.67% |
| February 28, 2025 | 2.97% |
| January 31, 2025 | 2.78% |
| December 31, 2024 | 2.99% |
| November 30, 2024 | 2.98% |
| October 31, 2024 | 2.99% |
| September 30, 2024 | 2.84% |
| August 31, 2024 | 2.87% |
| July 31, 2024 | 2.82% |
| June 30, 2024 | 2.77% |
| May 31, 2024 | 2.79% |
| April 30, 2024 | 3.02% |
| March 31, 2024 | 3.13% |
| Date | Value |
|---|---|
| February 29, 2024 | 3.03% |
| January 31, 2024 | 3.14% |
| December 31, 2023 | 3.09% |
| November 30, 2023 | 3.28% |
| October 31, 2023 | 3.48% |
| September 30, 2023 | 3.67% |
| August 31, 2023 | 3.81% |
| July 31, 2023 | 4.37% |
| June 30, 2023 | 4.44% |
| May 31, 2023 | 4.76% |
| April 30, 2023 | 4.83% |
| March 31, 2023 | 4.81% |
| February 28, 2023 | 4.92% |
| January 31, 2023 | 4.96% |
| December 31, 2022 | 4.96% |
| November 30, 2022 | 5.21% |
| October 31, 2022 | 5.43% |
| September 30, 2022 | 5.58% |
| August 31, 2022 | 5.34% |
| July 31, 2022 | 4.96% |
| June 30, 2022 | 5.19% |
| May 31, 2022 | 5.07% |
| April 30, 2022 | 5.25% |
| March 31, 2022 | 5.55% |
| February 28, 2022 | 5.57% |
News
Headline
Time (ET)
04/30 13:32
04/30 07:48
04/27 06:12
Basic Info
|
US PCE Price Index Excluding Food and Energy YoY is at 3.20%, compared to 3.00% last month and 2.67% last year. This is lower than the long term average of 3.23%. |
| Report | Personal Income and Outlays |
| Category | Consumer & Household Statistics |
| Region | United States |
| Source | Bureau of Economic Analysis |
Stats
| Last Value | 3.20% |
| Latest Period | Mar 2026 |
| Last Updated | Apr 30 2026, 11:58 EDT |
| Next Release | May 28 2026, 08:30 EDT |
| Long Term Average | 3.23% |
| Average Growth Rate | 3.71% |
| Value from Last Month | 3.00% |
| Change from Last Month | 6.71% |
| Value from 1 Year Ago | 2.67% |
| Change from 1 Year Ago | 19.94% |
| Frequency | Monthly |
| Unit | Percent |
| Adjustment | Seasonally Adjusted |
| Download Source File |