

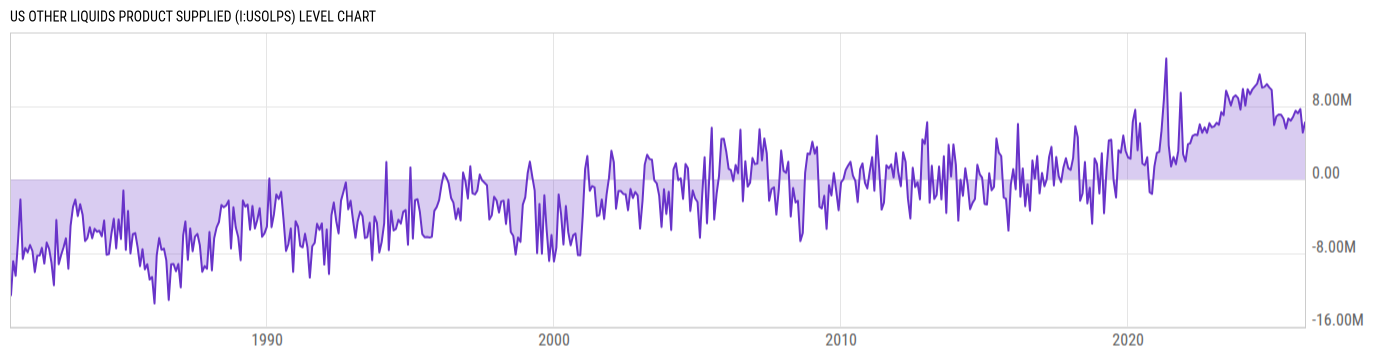
US Other Liquids Product Supplied (I:USOLPS)
6.21M bbl for Feb 2026
Level Chart
Basic Info
|
US Other Liquids Product Supplied is at a current level of 6.21M, up from 5.112M last month and down from 6.859M one year ago. This is a change of 21.48% from last month and -9.46% from one year ago. |
| Report | US Petroleum Product Supplied |
| Category | Energy |
| Region | United States |
| Source | Energy Information Administration |
Stats
| Last Value | 6.21M |
| Latest Period | Feb 2026 |
| Last Updated | Apr 30 2026, 15:35 EDT |
| Next Release | May 29 2026, 15:30 EDT |
| Average Growth Rate | -233.0% |
| Value from Last Month | 5.112M |
| Change from Last Month | 21.48% |
| Value from 1 Year Ago | 6.859M |
| Change from 1 Year Ago | -9.46% |
| Frequency | Monthly |
| Unit | Barrels |
| Adjustment | N/A |
| Download Source File |
Historical Data
| Date | Value |
|---|---|
| February 28, 2026 | 6.21M |
| January 31, 2026 | 5.112M |
| December 31, 2025 | 7.663M |
| November 30, 2025 | 7.212M |
| October 31, 2025 | 7.478M |
| September 30, 2025 | 6.834M |
| August 31, 2025 | 6.407M |
| July 31, 2025 | 6.638M |
| June 30, 2025 | 5.554M |
| May 31, 2025 | 6.622M |
| April 30, 2025 | 7.045M |
| March 31, 2025 | 7.075M |
| February 28, 2025 | 6.859M |
| January 31, 2025 | 5.921M |
| December 31, 2024 | 9.754M |
| November 30, 2024 | 10.03M |
| October 31, 2024 | 10.38M |
| September 30, 2024 | 10.09M |
| August 31, 2024 | 9.996M |
| July 31, 2024 | 11.44M |
| June 30, 2024 | 10.45M |
| May 31, 2024 | 10.14M |
| April 30, 2024 | 9.821M |
| March 31, 2024 | 9.284M |
| February 29, 2024 | 9.835M |
| Date | Value |
|---|---|
| January 31, 2024 | 8.044M |
| December 31, 2023 | 9.854M |
| November 30, 2023 | 7.605M |
| October 31, 2023 | 8.853M |
| September 30, 2023 | 9.156M |
| August 31, 2023 | 8.948M |
| July 31, 2023 | 8.061M |
| June 30, 2023 | 8.932M |
| May 31, 2023 | 9.671M |
| April 30, 2023 | 7.003M |
| March 31, 2023 | 7.336M |
| February 28, 2023 | 5.948M |
| January 31, 2023 | 6.178M |
| December 31, 2022 | 5.78M |
| November 30, 2022 | 5.689M |
| October 31, 2022 | 6.134M |
| September 30, 2022 | 5.091M |
| August 31, 2022 | 5.67M |
| July 31, 2022 | 5.093M |
| June 30, 2022 | 6.00M |
| May 31, 2022 | 4.823M |
| April 30, 2022 | 4.892M |
| March 31, 2022 | 4.744M |
| February 28, 2022 | 3.936M |
| January 31, 2022 | 3.855M |
News
Headline
Time (ET)
05/20 16:03
05/05 05:55
Basic Info
|
US Other Liquids Product Supplied is at a current level of 6.21M, up from 5.112M last month and down from 6.859M one year ago. This is a change of 21.48% from last month and -9.46% from one year ago. |
| Report | US Petroleum Product Supplied |
| Category | Energy |
| Region | United States |
| Source | Energy Information Administration |
Stats
| Last Value | 6.21M |
| Latest Period | Feb 2026 |
| Last Updated | Apr 30 2026, 15:35 EDT |
| Next Release | May 29 2026, 15:30 EDT |
| Average Growth Rate | -233.0% |
| Value from Last Month | 5.112M |
| Change from Last Month | 21.48% |
| Value from 1 Year Ago | 6.859M |
| Change from 1 Year Ago | -9.46% |
| Frequency | Monthly |
| Unit | Barrels |
| Adjustment | N/A |
| Download Source File |