

US Other Hydrocarbons and Oxygenates Product Supplied (I:USOHOPS)
6.216M bbl for Feb 2026
Level Chart
Basic Info
|
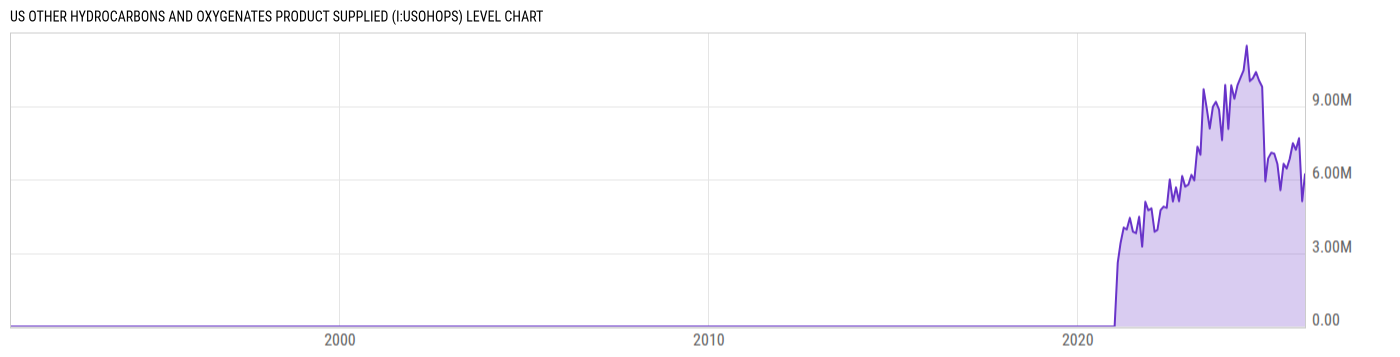
US Other Hydrocarbons and Oxygenates Product Supplied is at a current level of 6.216M, up from 5.117M last month and down from 6.862M one year ago. This is a change of 21.48% from last month and -9.41% from one year ago. |
| Report | US Petroleum Product Supplied |
| Category | Energy |
| Region | United States |
| Source | Energy Information Administration |
Stats
| Last Value | 6.216M |
| Latest Period | Feb 2026 |
| Last Updated | Apr 30 2026, 15:35 EDT |
| Next Release | May 29 2026, 15:30 EDT |
| Average Growth Rate | 33.22% |
| Value from Last Month | 5.117M |
| Change from Last Month | 21.48% |
| Value from 1 Year Ago | 6.862M |
| Change from 1 Year Ago | -9.41% |
| Frequency | Monthly |
| Unit | Barrels |
| Adjustment | N/A |
| Download Source File |
Historical Data
| Date | Value |
|---|---|
| February 28, 2026 | 6.216M |
| January 31, 2026 | 5.117M |
| December 31, 2025 | 7.681M |
| November 30, 2025 | 7.216M |
| October 31, 2025 | 7.478M |
| September 30, 2025 | 6.849M |
| August 31, 2025 | 6.447M |
| July 31, 2025 | 6.639M |
| June 30, 2025 | 5.562M |
| May 31, 2025 | 6.63M |
| April 30, 2025 | 7.049M |
| March 31, 2025 | 7.095M |
| February 28, 2025 | 6.862M |
| January 31, 2025 | 5.925M |
| December 31, 2024 | 9.786M |
| November 30, 2024 | 10.04M |
| October 31, 2024 | 10.39M |
| September 30, 2024 | 10.13M |
| August 31, 2024 | 10.02M |
| July 31, 2024 | 11.46M |
| June 30, 2024 | 10.45M |
| May 31, 2024 | 10.16M |
| April 30, 2024 | 9.838M |
| March 31, 2024 | 9.292M |
| February 29, 2024 | 9.842M |
| Date | Value |
|---|---|
| January 31, 2024 | 8.061M |
| December 31, 2023 | 9.862M |
| November 30, 2023 | 7.607M |
| October 31, 2023 | 8.857M |
| September 30, 2023 | 9.171M |
| August 31, 2023 | 8.97M |
| July 31, 2023 | 8.08M |
| June 30, 2023 | 8.935M |
| May 31, 2023 | 9.687M |
| April 30, 2023 | 7.011M |
| March 31, 2023 | 7.339M |
| February 28, 2023 | 5.966M |
| January 31, 2023 | 6.188M |
| December 31, 2022 | 5.788M |
| November 30, 2022 | 5.709M |
| October 31, 2022 | 6.145M |
| September 30, 2022 | 5.112M |
| August 31, 2022 | 5.679M |
| July 31, 2022 | 5.103M |
| June 30, 2022 | 6.004M |
| May 31, 2022 | 4.841M |
| April 30, 2022 | 4.896M |
| March 31, 2022 | 4.753M |
| February 28, 2022 | 3.942M |
| January 31, 2022 | 3.866M |
News
Headline
Time (ET)
05/20 16:03
05/05 05:55
Basic Info
|
US Other Hydrocarbons and Oxygenates Product Supplied is at a current level of 6.216M, up from 5.117M last month and down from 6.862M one year ago. This is a change of 21.48% from last month and -9.41% from one year ago. |
| Report | US Petroleum Product Supplied |
| Category | Energy |
| Region | United States |
| Source | Energy Information Administration |
Stats
| Last Value | 6.216M |
| Latest Period | Feb 2026 |
| Last Updated | Apr 30 2026, 15:35 EDT |
| Next Release | May 29 2026, 15:30 EDT |
| Average Growth Rate | 33.22% |
| Value from Last Month | 5.117M |
| Change from Last Month | 21.48% |
| Value from 1 Year Ago | 6.862M |
| Change from 1 Year Ago | -9.41% |
| Frequency | Monthly |
| Unit | Barrels |
| Adjustment | N/A |
| Download Source File |