

US Natural Gas Liquids and Liquid Refinery Gases Product Supplied (I:USNGLLRG)
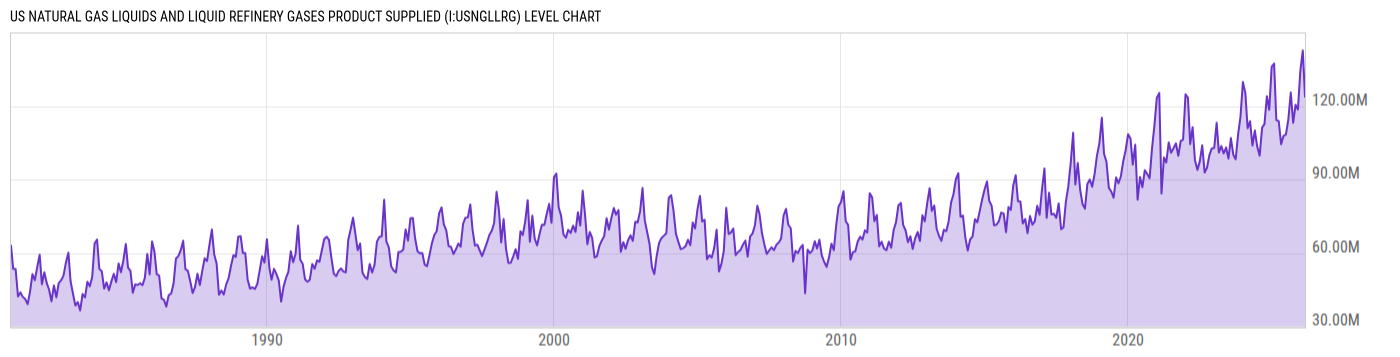
123.77M bbl for Feb 2026
Level Chart
Basic Info
|
US Natural Gas Liquids and Liquid Refinery Gases Product Supplied is at a current level of 123.77M, down from 142.61M last month and up from 114.26M one year ago. This is a change of -13.21% from last month and 8.32% from one year ago. |
| Report | US Petroleum Product Supplied |
| Category | Energy |
| Region | United States |
| Source | Energy Information Administration |
Stats
| Last Value | 123.77M |
| Latest Period | Feb 2026 |
| Last Updated | Apr 30 2026, 15:34 EDT |
| Next Release | May 29 2026, 15:30 EDT |
| Average Growth Rate | 7.40% |
| Value from Last Month | 142.61M |
| Change from Last Month | -13.21% |
| Value from 1 Year Ago | 114.26M |
| Change from 1 Year Ago | 8.32% |
| Frequency | Monthly |
| Unit | Barrels |
| Adjustment | N/A |
| Download Source File |
Historical Data
| Date | Value |
|---|---|
| February 28, 2026 | 123.77M |
| January 31, 2026 | 142.61M |
| December 31, 2025 | 134.45M |
| November 30, 2025 | 118.60M |
| October 31, 2025 | 120.50M |
| September 30, 2025 | 113.15M |
| August 31, 2025 | 125.51M |
| July 31, 2025 | 114.54M |
| June 30, 2025 | 108.35M |
| May 31, 2025 | 107.85M |
| April 30, 2025 | 104.41M |
| March 31, 2025 | 113.77M |
| February 28, 2025 | 114.26M |
| January 31, 2025 | 137.33M |
| December 31, 2024 | 135.98M |
| November 30, 2024 | 118.45M |
| October 31, 2024 | 123.94M |
| September 30, 2024 | 112.61M |
| August 31, 2024 | 111.19M |
| July 31, 2024 | 99.75M |
| June 30, 2024 | 103.44M |
| May 31, 2024 | 109.98M |
| April 30, 2024 | 103.88M |
| March 31, 2024 | 113.79M |
| February 29, 2024 | 110.95M |
| Date | Value |
|---|---|
| January 31, 2024 | 125.36M |
| December 31, 2023 | 129.75M |
| November 30, 2023 | 115.60M |
| October 31, 2023 | 108.48M |
| September 30, 2023 | 98.27M |
| August 31, 2023 | 100.09M |
| July 31, 2023 | 106.92M |
| June 30, 2023 | 98.54M |
| May 31, 2023 | 103.04M |
| April 30, 2023 | 100.66M |
| March 31, 2023 | 103.61M |
| February 28, 2023 | 101.01M |
| January 31, 2023 | 113.18M |
| December 31, 2022 | 102.88M |
| November 30, 2022 | 102.70M |
| October 31, 2022 | 99.98M |
| September 30, 2022 | 94.79M |
| August 31, 2022 | 92.87M |
| July 31, 2022 | 103.94M |
| June 30, 2022 | 97.29M |
| May 31, 2022 | 93.93M |
| April 30, 2022 | 97.90M |
| March 31, 2022 | 111.35M |
| February 28, 2022 | 104.44M |
| January 31, 2022 | 123.36M |
News
Headline
Time (ET)
05/20 16:03
05/05 05:55
04/28 05:55
Basic Info
|
US Natural Gas Liquids and Liquid Refinery Gases Product Supplied is at a current level of 123.77M, down from 142.61M last month and up from 114.26M one year ago. This is a change of -13.21% from last month and 8.32% from one year ago. |
| Report | US Petroleum Product Supplied |
| Category | Energy |
| Region | United States |
| Source | Energy Information Administration |
Stats
| Last Value | 123.77M |
| Latest Period | Feb 2026 |
| Last Updated | Apr 30 2026, 15:34 EDT |
| Next Release | May 29 2026, 15:30 EDT |
| Average Growth Rate | 7.40% |
| Value from Last Month | 142.61M |
| Change from Last Month | -13.21% |
| Value from 1 Year Ago | 114.26M |
| Change from 1 Year Ago | 8.32% |
| Frequency | Monthly |
| Unit | Barrels |
| Adjustment | N/A |
| Download Source File |