

US Natural Gas Lease and Plant Fuel Consumption (I:USNGLPFC)
159.76B cf for Feb 2026
Level Chart
Basic Info
|
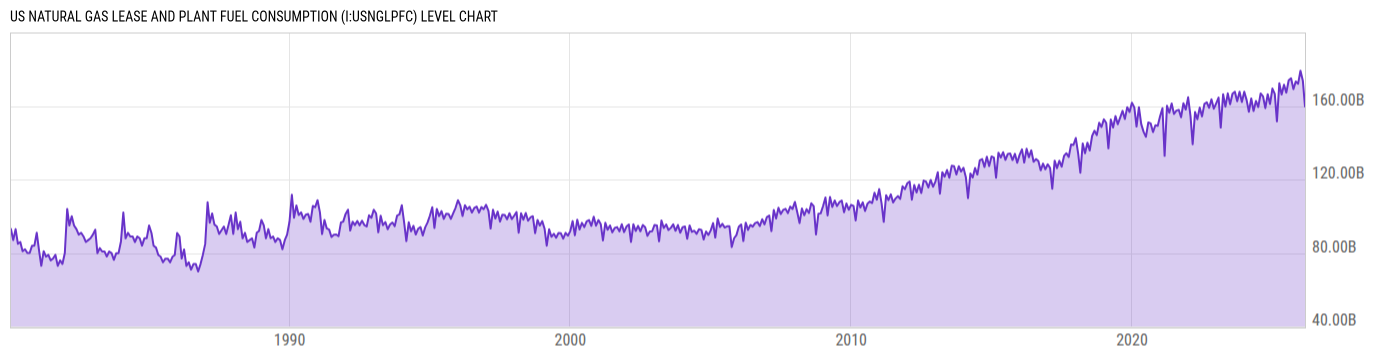
US Natural Gas Lease and Plant Fuel Consumption is at a current level of 159.76B, down from 173.78B last month and up from 151.66B one year ago. This is a change of -8.07% from last month and 5.34% from one year ago. |
| Report | Natural Gas Monthly |
| Category | Energy |
| Region | United States |
| Source | Energy Information Administration |
Stats
| Last Value | 159.76B |
| Latest Period | Feb 2026 |
| Last Updated | Apr 30 2026, 11:23 EDT |
| Next Release | May 29 2026, 10:30 EDT |
| Average Growth Rate | 3.12% |
| Value from Last Month | 173.78B |
| Change from Last Month | -8.07% |
| Value from 1 Year Ago | 151.66B |
| Change from 1 Year Ago | 5.34% |
| Frequency | Monthly |
| Unit | Cubic Feet |
| Adjustment | N/A |
| Download Source File |
Historical Data
| Date | Value |
|---|---|
| February 28, 2026 | 159.76B |
| January 31, 2026 | 173.78B |
| December 31, 2025 | 179.23B |
| November 30, 2025 | 172.03B |
| October 31, 2025 | 173.30B |
| September 30, 2025 | 169.19B |
| August 31, 2025 | 175.07B |
| July 31, 2025 | 174.02B |
| June 30, 2025 | 167.26B |
| May 31, 2025 | 171.53B |
| April 30, 2025 | 166.27B |
| March 31, 2025 | 172.36B |
| February 28, 2025 | 151.66B |
| January 31, 2025 | 166.55B |
| December 31, 2024 | 169.47B |
| November 30, 2024 | 161.06B |
| October 31, 2024 | 166.40B |
| September 30, 2024 | 158.82B |
| August 31, 2024 | 165.28B |
| July 31, 2024 | 166.83B |
| June 30, 2024 | 159.42B |
| May 31, 2024 | 162.78B |
| April 30, 2024 | 157.29B |
| March 31, 2024 | 164.06B |
| February 29, 2024 | 156.87B |
| Date | Value |
|---|---|
| January 31, 2024 | 163.19B |
| December 31, 2023 | 167.79B |
| November 30, 2023 | 162.16B |
| October 31, 2023 | 167.79B |
| September 30, 2023 | 162.57B |
| August 31, 2023 | 167.79B |
| July 31, 2023 | 166.62B |
| June 30, 2023 | 160.91B |
| May 31, 2023 | 166.88B |
| April 30, 2023 | 159.63B |
| March 31, 2023 | 166.42B |
| February 28, 2023 | 148.24B |
| January 31, 2023 | 164.54B |
| December 31, 2022 | 161.46B |
| November 30, 2022 | 158.53B |
| October 31, 2022 | 163.61B |
| September 30, 2022 | 159.04B |
| August 31, 2022 | 161.99B |
| July 31, 2022 | 161.17B |
| June 30, 2022 | 154.35B |
| May 31, 2022 | 159.11B |
| April 30, 2022 | 152.77B |
| March 31, 2022 | 156.74B |
| February 28, 2022 | 139.17B |
| January 31, 2022 | 154.49B |
News
Headline
Time (ET)
05/22 06:05
05/21 09:30
05/15 06:06
05/07 09:33
04/30 09:31
04/28 09:25
Basic Info
|
US Natural Gas Lease and Plant Fuel Consumption is at a current level of 159.76B, down from 173.78B last month and up from 151.66B one year ago. This is a change of -8.07% from last month and 5.34% from one year ago. |
| Report | Natural Gas Monthly |
| Category | Energy |
| Region | United States |
| Source | Energy Information Administration |
Stats
| Last Value | 159.76B |
| Latest Period | Feb 2026 |
| Last Updated | Apr 30 2026, 11:23 EDT |
| Next Release | May 29 2026, 10:30 EDT |
| Average Growth Rate | 3.12% |
| Value from Last Month | 173.78B |
| Change from Last Month | -8.07% |
| Value from 1 Year Ago | 151.66B |
| Change from 1 Year Ago | 5.34% |
| Frequency | Monthly |
| Unit | Cubic Feet |
| Adjustment | N/A |
| Download Source File |