

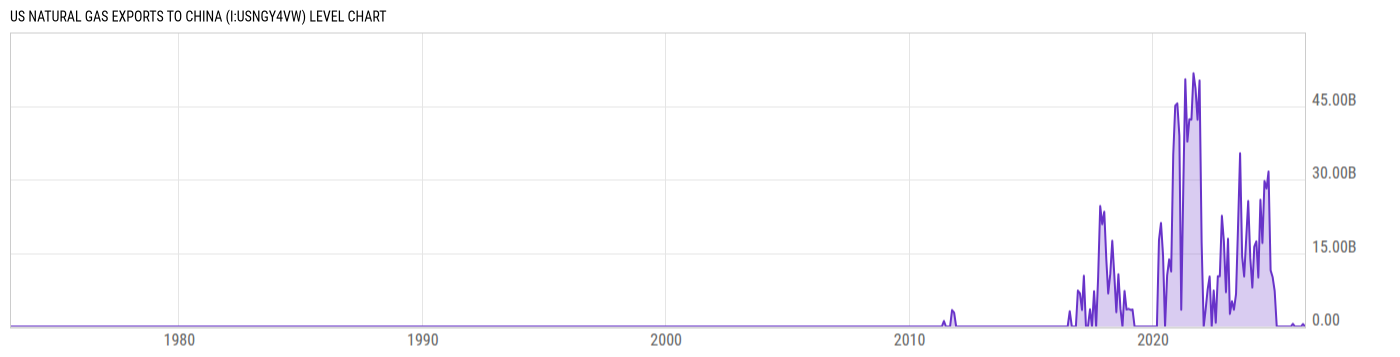
US Natural Gas Exports to China (I:USNGY4VW)
Level Chart
Basic Info
|
US Natural Gas Exports to China is at a current level of 0.000, down from 508.73M last month. This is a change of -100.0% from last month. |
| Report | Natural Gas Monthly |
| Category | Energy |
| Region | United States |
| Source | Energy Information Administration |
Stats
| Last Value | 0.00 |
| Latest Period | Mar 2026 |
| Last Updated | May 29 2026, 10:35 EDT |
| Next Release | Jun 30 2026, 10:30 EDT |
| Average Growth Rate | 253.0% |
| Value from Last Month | 508.73M |
| Change from Last Month | -100.0% |
| Value from 1 Year Ago | 0.00 |
| Change from 1 Year Ago | N/A |
| Frequency | Monthly |
| Unit | Cubic Feet |
| Adjustment | N/A |
| Download Source File | |
| Notes | Liquefied natural gas. |
Historical Data
| Date | Value |
|---|---|
| March 31, 2026 | 0.00 |
| February 28, 2026 | 508.73M |
| January 31, 2026 | 0.00 |
| December 31, 2025 | 0.00 |
| November 30, 2025 | 0.00 |
| October 31, 2025 | 0.00 |
| September 30, 2025 | 545.84M |
| August 31, 2025 | 0.00 |
| July 31, 2025 | 0.00 |
| June 30, 2025 | 0.00 |
| May 31, 2025 | 0.00 |
| April 30, 2025 | 0.00 |
| March 31, 2025 | 0.00 |
| February 28, 2025 | 0.00 |
| January 31, 2025 | 0.00 |
| December 31, 2024 | 7.244B |
| November 30, 2024 | 10.11B |
| October 31, 2024 | 11.45B |
| September 30, 2024 | 31.62B |
| August 31, 2024 | 28.15B |
| July 31, 2024 | 29.70B |
| June 30, 2024 | 17.04B |
| May 31, 2024 | 25.86B |
| April 30, 2024 | 10.03B |
| March 31, 2024 | 17.38B |
| Date | Value |
|---|---|
| February 29, 2024 | 16.31B |
| January 31, 2024 | 7.944B |
| December 31, 2023 | 13.95B |
| November 30, 2023 | 25.60B |
| October 31, 2023 | 18.01B |
| September 30, 2023 | 10.22B |
| August 31, 2023 | 14.25B |
| July 31, 2023 | 35.34B |
| June 30, 2023 | 20.26B |
| May 31, 2023 | 6.593B |
| April 30, 2023 | 3.426B |
| March 31, 2023 | 5.132B |
| February 28, 2023 | 2.565B |
| January 31, 2023 | 17.90B |
| December 31, 2022 | 6.992B |
| November 30, 2022 | 17.31B |
| October 31, 2022 | 22.60B |
| September 30, 2022 | 10.28B |
| August 31, 2022 | 10.27B |
| July 31, 2022 | 783.94M |
| June 30, 2022 | 7.329B |
| May 31, 2022 | 0.00 |
| April 30, 2022 | 10.22B |
| March 31, 2022 | 7.527B |
| February 28, 2022 | 3.357B |
News
Headline
Time (ET)
05/22 06:05
05/21 09:30
05/15 06:06
Basic Info
|
US Natural Gas Exports to China is at a current level of 0.000, down from 508.73M last month. This is a change of -100.0% from last month. |
| Report | Natural Gas Monthly |
| Category | Energy |
| Region | United States |
| Source | Energy Information Administration |
Stats
| Last Value | 0.00 |
| Latest Period | Mar 2026 |
| Last Updated | May 29 2026, 10:35 EDT |
| Next Release | Jun 30 2026, 10:30 EDT |
| Average Growth Rate | 253.0% |
| Value from Last Month | 508.73M |
| Change from Last Month | -100.0% |
| Value from 1 Year Ago | 0.00 |
| Change from 1 Year Ago | N/A |
| Frequency | Monthly |
| Unit | Cubic Feet |
| Adjustment | N/A |
| Download Source File | |
| Notes | Liquefied natural gas. |