

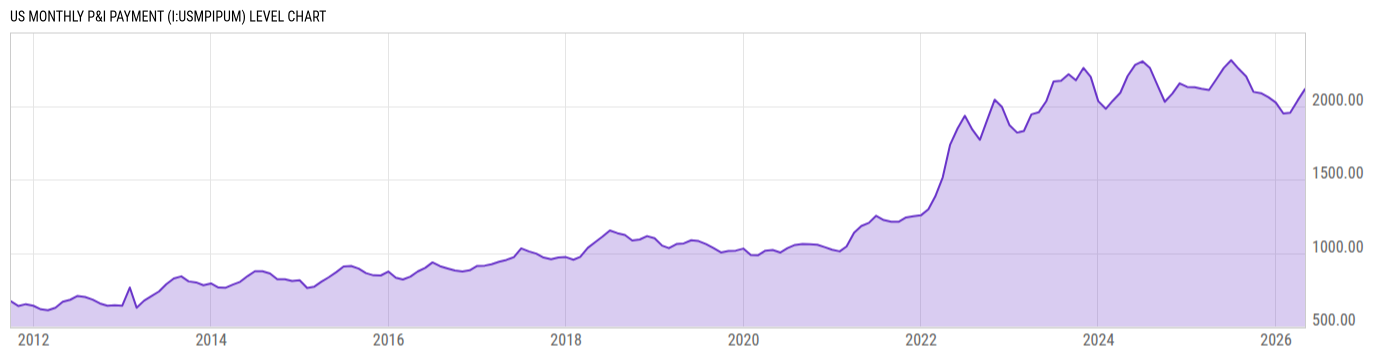
US Monthly P&I Payment (I:USMPIPUM)
2115.00 USD for Apr 2026
Level Chart
Basic Info
|
US Monthly P&I Payment is at a current level of 2115.00, up from 2038.00 last month and down from 2182.00 one year ago. This is a change of 3.78% from last month and -3.07% from one year ago. |
| Report | Monthly Report on Housing Affordability |
| Category | House Prices |
| Region | United States |
| Source | National Association of Realtors |
Stats
| Last Value | 2115.00 |
| Latest Period | Apr 2026 |
| Last Updated | May 11 2026, 11:03 EDT |
| Next Release | Jun 9 2026, 10:00 EDT |
| Average Growth Rate | 8.83% |
| Value from Last Month | 2038.00 |
| Change from Last Month | 3.78% |
| Value from 1 Year Ago | 2182.00 |
| Change from 1 Year Ago | -3.07% |
| Frequency | Monthly |
| Unit | USD |
| Adjustment | Not Seasonally Adjusted |
| Download Source File |
Historical Data
| Date | Value |
|---|---|
| April 30, 2026 | 2115.00 |
| March 31, 2026 | 2038.00 |
| February 28, 2026 | 1954.00 |
| January 31, 2026 | 1949.00 |
| December 31, 2025 | 2023.00 |
| November 30, 2025 | 2060.00 |
| October 31, 2025 | 2087.00 |
| September 30, 2025 | 2096.00 |
| August 31, 2025 | 2201.00 |
| July 31, 2025 | 2253.00 |
| June 30, 2025 | 2311.00 |
| May 31, 2025 | 2259.00 |
| April 30, 2025 | 2182.00 |
| March 31, 2025 | 2109.00 |
| February 28, 2025 | 2117.00 |
| January 31, 2025 | 2127.00 |
| December 31, 2024 | 2130.00 |
| November 30, 2024 | 2154.00 |
| October 31, 2024 | 2084.00 |
| September 30, 2024 | 2029.00 |
| August 31, 2024 | 2140.00 |
| July 31, 2024 | 2258.00 |
| June 30, 2024 | 2304.00 |
| May 31, 2024 | 2280.00 |
| April 30, 2024 | 2204.00 |
| Date | Value |
|---|---|
| March 31, 2024 | 2090.00 |
| February 29, 2024 | 2036.00 |
| January 31, 2024 | 1981.00 |
| December 31, 2023 | 2033.00 |
| November 30, 2023 | 2198.00 |
| October 31, 2023 | 2259.00 |
| September 30, 2023 | 2175.00 |
| August 31, 2023 | 2216.00 |
| July 31, 2023 | 2171.00 |
| June 30, 2023 | 2166.00 |
| May 31, 2023 | 2032.00 |
| April 30, 2023 | 1957.00 |
| March 31, 2023 | 1943.00 |
| February 28, 2023 | 1830.00 |
| January 31, 2023 | 1819.00 |
| December 31, 2022 | 1869.00 |
| November 30, 2022 | 1993.00 |
| October 31, 2022 | 2043.00 |
| September 30, 2022 | 1905.00 |
| August 31, 2022 | 1770.00 |
| July 31, 2022 | 1839.00 |
| June 30, 2022 | 1933.00 |
| May 31, 2022 | 1847.00 |
| April 30, 2022 | 1735.00 |
| March 31, 2022 | 1515.00 |
News
Headline
Time (ET)
05/19 15:28
05/15 07:05
05/07 12:00
Basic Info
|
US Monthly P&I Payment is at a current level of 2115.00, up from 2038.00 last month and down from 2182.00 one year ago. This is a change of 3.78% from last month and -3.07% from one year ago. |
| Report | Monthly Report on Housing Affordability |
| Category | House Prices |
| Region | United States |
| Source | National Association of Realtors |
Stats
| Last Value | 2115.00 |
| Latest Period | Apr 2026 |
| Last Updated | May 11 2026, 11:03 EDT |
| Next Release | Jun 9 2026, 10:00 EDT |
| Average Growth Rate | 8.83% |
| Value from Last Month | 2038.00 |
| Change from Last Month | 3.78% |
| Value from 1 Year Ago | 2182.00 |
| Change from 1 Year Ago | -3.07% |
| Frequency | Monthly |
| Unit | USD |
| Adjustment | Not Seasonally Adjusted |
| Download Source File |