

US Midgrade Retail Gasoline Prices (I:USMRGPNM)
4.709 USD/gal for Apr 2026
Level Chart
Basic Info
|
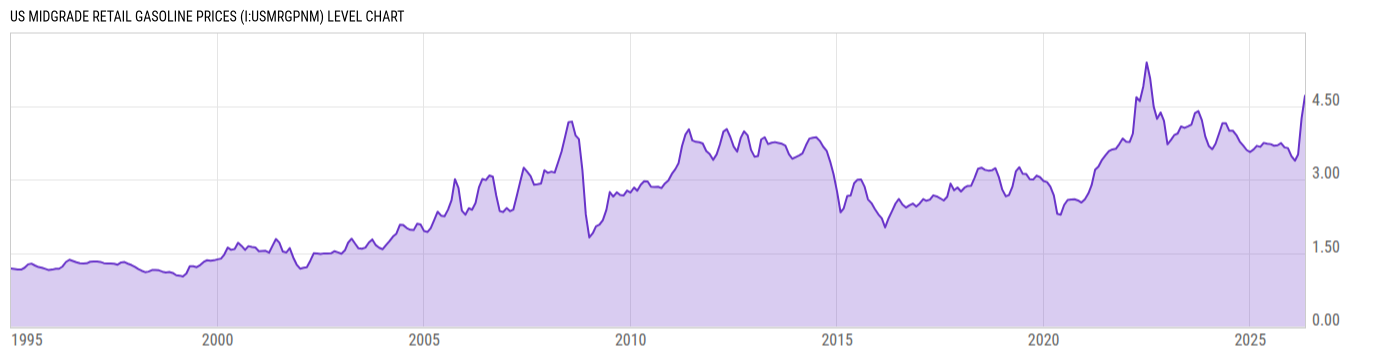
US Midgrade Retail Gasoline Prices is at a current level of 4.709, up from 4.251 last month and up from 3.747 one year ago. This is a change of 10.77% from last month and 25.67% from one year ago. |
| Report | Weekly Petroleum Status |
| Category | Energy |
| Region | United States |
| Source | Energy Information Administration |
Stats
| Last Value | 4.709 |
| Latest Period | Apr 2026 |
| Last Updated | Apr 29 2026, 16:38 EDT |
| Next Release | May 20 2026, 12:00 EDT |
| Average Growth Rate | 6.26% |
| Value from Last Month | 4.251 |
| Change from Last Month | 10.77% |
| Value from 1 Year Ago | 3.747 |
| Change from 1 Year Ago | 25.67% |
| Frequency | Monthly |
| Unit | USD per Gallon |
| Adjustment | N/A |
| Download Source File |
Historical Data
| Date | Value |
|---|---|
| April 30, 2026 | 4.709 |
| March 31, 2026 | 4.251 |
| February 28, 2026 | 3.51 |
| January 31, 2026 | 3.383 |
| December 31, 2025 | 3.476 |
| November 30, 2025 | 3.64 |
| October 31, 2025 | 3.656 |
| September 30, 2025 | 3.743 |
| August 31, 2025 | 3.699 |
| July 31, 2025 | 3.689 |
| June 30, 2025 | 3.722 |
| May 31, 2025 | 3.729 |
| April 30, 2025 | 3.747 |
| March 31, 2025 | 3.665 |
| February 28, 2025 | 3.687 |
| January 31, 2025 | 3.615 |
| December 31, 2024 | 3.561 |
| November 30, 2024 | 3.602 |
| October 31, 2024 | 3.691 |
| September 30, 2024 | 3.774 |
| August 31, 2024 | 3.907 |
| July 31, 2024 | 3.995 |
| June 30, 2024 | 3.993 |
| May 31, 2024 | 4.146 |
| April 30, 2024 | 4.148 |
| Date | Value |
|---|---|
| March 31, 2024 | 3.938 |
| February 29, 2024 | 3.729 |
| January 31, 2024 | 3.619 |
| December 31, 2023 | 3.685 |
| November 30, 2023 | 3.88 |
| October 31, 2023 | 4.211 |
| September 30, 2023 | 4.396 |
| August 31, 2023 | 4.357 |
| July 31, 2023 | 4.121 |
| June 30, 2023 | 4.084 |
| May 31, 2023 | 4.052 |
| April 30, 2023 | 4.083 |
| March 31, 2023 | 3.939 |
| February 28, 2023 | 3.904 |
| January 31, 2023 | 3.809 |
| December 31, 2022 | 3.718 |
| November 30, 2022 | 4.197 |
| October 31, 2022 | 4.368 |
| September 30, 2022 | 4.237 |
| August 31, 2022 | 4.487 |
| July 31, 2022 | 5.06 |
| June 30, 2022 | 5.39 |
| May 31, 2022 | 4.90 |
| April 30, 2022 | 4.598 |
| March 31, 2022 | 4.681 |
News
Headline
Time (ET)
05/13 14:39
04/28 14:43
04/16 06:28
Basic Info
|
US Midgrade Retail Gasoline Prices is at a current level of 4.709, up from 4.251 last month and up from 3.747 one year ago. This is a change of 10.77% from last month and 25.67% from one year ago. |
| Report | Weekly Petroleum Status |
| Category | Energy |
| Region | United States |
| Source | Energy Information Administration |
Stats
| Last Value | 4.709 |
| Latest Period | Apr 2026 |
| Last Updated | Apr 29 2026, 16:38 EDT |
| Next Release | May 20 2026, 12:00 EDT |
| Average Growth Rate | 6.26% |
| Value from Last Month | 4.251 |
| Change from Last Month | 10.77% |
| Value from 1 Year Ago | 3.747 |
| Change from 1 Year Ago | 25.67% |
| Frequency | Monthly |
| Unit | USD per Gallon |
| Adjustment | N/A |
| Download Source File |