

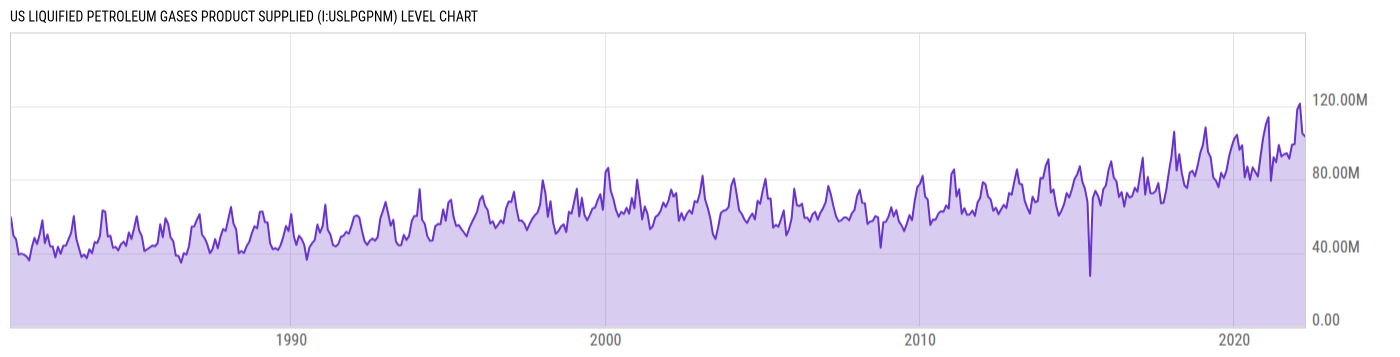
US Liquified Petroleum Gases Product Supplied (I:USLPGPNM)
103.56M bbl for Mar 2022
Level Chart
Basic Info
|
US Liquified Petroleum Gases Product Supplied is at a current level of 103.56M, down from 105.13M last month and up from 92.17M one year ago. This is a change of -1.50% from last month and 12.35% from one year ago. |
| Report | US Petroleum Product Supplied |
| Category | Energy |
| Region | United States |
| Source | Energy Information Administration |
Stats
| Last Value | 103.56M |
| Latest Period | Mar 2022 |
| Last Updated | May 31 2022, 15:31 EDT |
| Next Release | May 29 2026, 15:30 EDT |
| Average Growth Rate | 9.94% |
| Value from Last Month | 105.13M |
| Change from Last Month | -1.50% |
| Value from 1 Year Ago | 92.17M |
| Change from 1 Year Ago | 12.35% |
| Frequency | Monthly |
| Unit | Barrels |
| Adjustment | N/A |
| Download Source File |
Historical Data
| Date | Value |
|---|---|
| March 31, 2022 | 103.56M |
| February 28, 2022 | 105.13M |
| January 31, 2022 | 121.31M |
| December 31, 2021 | 118.08M |
| November 30, 2021 | 99.18M |
| October 31, 2021 | 98.94M |
| September 30, 2021 | 91.33M |
| August 31, 2021 | 94.26M |
| July 31, 2021 | 93.72M |
| June 30, 2021 | 92.55M |
| May 31, 2021 | 98.78M |
| April 30, 2021 | 89.46M |
| March 31, 2021 | 92.17M |
| February 28, 2021 | 79.30M |
| January 31, 2021 | 113.90M |
| December 31, 2020 | 109.83M |
| November 30, 2020 | 102.78M |
| October 31, 2020 | 92.79M |
| September 30, 2020 | 81.70M |
| August 31, 2020 | 84.10M |
| July 31, 2020 | 86.59M |
| June 30, 2020 | 79.79M |
| May 31, 2020 | 87.02M |
| April 30, 2020 | 81.20M |
| March 31, 2020 | 98.65M |
| Date | Value |
|---|---|
| February 29, 2020 | 96.14M |
| January 31, 2020 | 104.35M |
| December 31, 2019 | 102.27M |
| November 30, 2019 | 97.90M |
| October 31, 2019 | 92.53M |
| September 30, 2019 | 84.65M |
| August 31, 2019 | 80.76M |
| July 31, 2019 | 83.62M |
| June 30, 2019 | 75.84M |
| May 31, 2019 | 79.35M |
| April 30, 2019 | 81.19M |
| March 31, 2019 | 92.12M |
| February 28, 2019 | 95.02M |
| January 31, 2019 | 108.34M |
| December 31, 2018 | 98.83M |
| November 30, 2018 | 94.43M |
| October 31, 2018 | 87.56M |
| September 30, 2018 | 81.74M |
| August 31, 2018 | 84.72M |
| July 31, 2018 | 83.74M |
| June 30, 2018 | 75.38M |
| May 31, 2018 | 76.69M |
| April 30, 2018 | 83.42M |
| March 31, 2018 | 93.74M |
| February 28, 2018 | 84.88M |
News
Headline
Time (ET)
05/20 16:03
05/05 05:55
Basic Info
|
US Liquified Petroleum Gases Product Supplied is at a current level of 103.56M, down from 105.13M last month and up from 92.17M one year ago. This is a change of -1.50% from last month and 12.35% from one year ago. |
| Report | US Petroleum Product Supplied |
| Category | Energy |
| Region | United States |
| Source | Energy Information Administration |
Stats
| Last Value | 103.56M |
| Latest Period | Mar 2022 |
| Last Updated | May 31 2022, 15:31 EDT |
| Next Release | May 29 2026, 15:30 EDT |
| Average Growth Rate | 9.94% |
| Value from Last Month | 105.13M |
| Change from Last Month | -1.50% |
| Value from 1 Year Ago | 92.17M |
| Change from 1 Year Ago | 12.35% |
| Frequency | Monthly |
| Unit | Barrels |
| Adjustment | N/A |
| Download Source File |