

US Liquefied Natural Gas Imports (I:USLNGI)
2672.83 USD/thou cf for Feb 2026
Level Chart
Basic Info
|
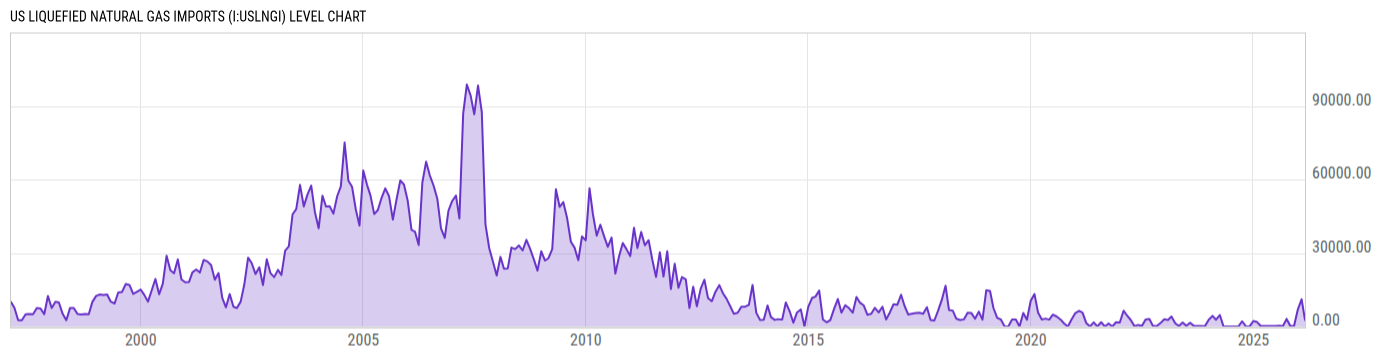
US Liquefied Natural Gas Imports is at a current level of 2672.83, down from 11117.92 last month and up from 302.45 one year ago. This is a change of -75.96% from last month and 783.7% from one year ago. |
| Report | Natural Gas Monthly |
| Category | Energy |
| Region | United States |
| Source | Energy Information Administration |
Stats
| Last Value | 2672.83 |
| Latest Period | Feb 2026 |
| Last Updated | Apr 30 2026, 11:22 EDT |
| Next Release | May 29 2026, 10:30 EDT |
| Average Growth Rate | 5.63K% |
| Value from Last Month | 11117.92 |
| Change from Last Month | -75.96% |
| Value from 1 Year Ago | 302.45 |
| Change from 1 Year Ago | 783.7% |
| Frequency | Monthly |
| Unit | USD per Thousand Cubic Feet |
| Adjustment | N/A |
| Download Source File |
Historical Data
| Date | Value |
|---|---|
| February 28, 2026 | 2672.83 |
| January 31, 2026 | 11117.92 |
| December 31, 2025 | 6900.40 |
| November 30, 2025 | 195.51 |
| October 31, 2025 | 192.62 |
| September 30, 2025 | 3094.69 |
| August 31, 2025 | 236.06 |
| July 31, 2025 | 271.35 |
| June 30, 2025 | 196.66 |
| May 31, 2025 | 218.80 |
| April 30, 2025 | 165.25 |
| March 31, 2025 | 207.47 |
| February 28, 2025 | 302.45 |
| January 31, 2025 | 1805.00 |
| December 31, 2024 | 2226.14 |
| November 30, 2024 | 41.76 |
| October 31, 2024 | 61.46 |
| September 30, 2024 | 2140.74 |
| August 31, 2024 | 64.64 |
| July 31, 2024 | 49.36 |
| June 30, 2024 | 27.83 |
| May 31, 2024 | 28.97 |
| April 30, 2024 | 45.06 |
| March 31, 2024 | 4692.14 |
| February 29, 2024 | 2763.17 |
| Date | Value |
|---|---|
| January 31, 2024 | 4339.24 |
| December 31, 2023 | 2760.72 |
| November 30, 2023 | 151.76 |
| October 31, 2023 | 220.64 |
| September 30, 2023 | 177.88 |
| August 31, 2023 | 260.80 |
| July 31, 2023 | 1501.29 |
| June 30, 2023 | 267.12 |
| May 31, 2023 | 1621.22 |
| April 30, 2023 | 199.77 |
| March 31, 2023 | 1358.23 |
| February 28, 2023 | 4056.58 |
| January 31, 2023 | 2663.25 |
| December 31, 2022 | 2983.44 |
| November 30, 2022 | 1395.33 |
| October 31, 2022 | 207.76 |
| September 30, 2022 | 160.44 |
| August 31, 2022 | 3051.70 |
| July 31, 2022 | 2886.47 |
| June 30, 2022 | 177.98 |
| May 31, 2022 | 645.01 |
| April 30, 2022 | 151.04 |
| March 31, 2022 | 2649.25 |
| February 28, 2022 | 4502.93 |
| January 31, 2022 | 6456.25 |
News
Headline
Time (ET)
05/22 06:05
05/21 09:30
05/15 06:06
05/07 09:33
04/30 09:31
04/28 09:25
Basic Info
|
US Liquefied Natural Gas Imports is at a current level of 2672.83, down from 11117.92 last month and up from 302.45 one year ago. This is a change of -75.96% from last month and 783.7% from one year ago. |
| Report | Natural Gas Monthly |
| Category | Energy |
| Region | United States |
| Source | Energy Information Administration |
Stats
| Last Value | 2672.83 |
| Latest Period | Feb 2026 |
| Last Updated | Apr 30 2026, 11:22 EDT |
| Next Release | May 29 2026, 10:30 EDT |
| Average Growth Rate | 5.63K% |
| Value from Last Month | 11117.92 |
| Change from Last Month | -75.96% |
| Value from 1 Year Ago | 302.45 |
| Change from 1 Year Ago | 783.7% |
| Frequency | Monthly |
| Unit | USD per Thousand Cubic Feet |
| Adjustment | N/A |
| Download Source File |