

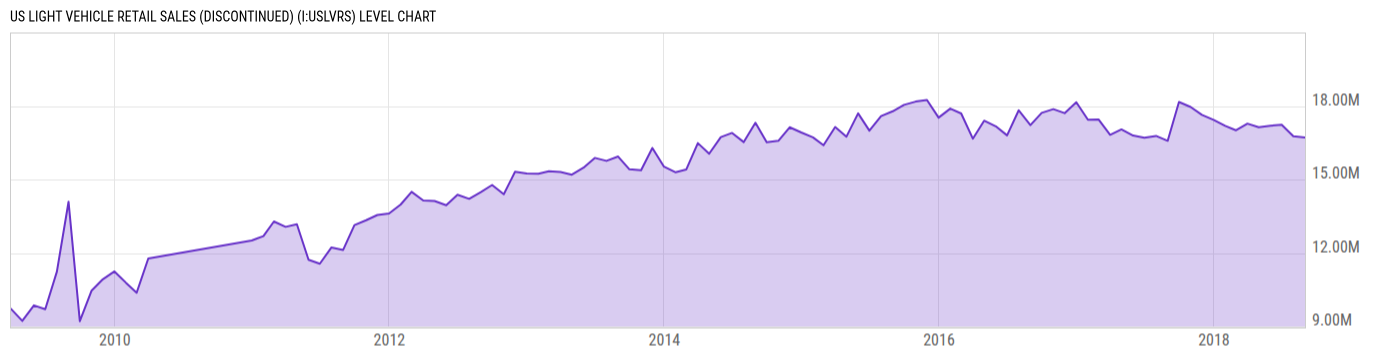
US Light Vehicle Retail Sales (DISCONTINUED) (I:USLVRS)
16.72M for Aug 2018
Level Chart
Basic Info
|
US Light Vehicle Retail Sales is at a current level of 16.72M, down from 16.77M last month and up from 16.58M one year ago. This is a change of -0.30% from last month and 0.84% from one year ago. |
| Report | Motor Intelligence Light Vehicle Retail Sales |
| Category | Retail and Services Business Statistics |
| Region | United States |
| Source | Motor Intelligence |
Stats
| Last Value | 16.72M |
| Latest Period | Aug 2018 |
| Last Updated | Sep 6 2018, 13:39 EDT |
| Next Release | Nov 1 2018, 10:30 EDT (E) |
| Average Growth Rate | 7.74% |
| Value from Last Month | 16.77M |
| Change from Last Month | -0.30% |
| Value from 1 Year Ago | 16.58M |
| Change from 1 Year Ago | 0.84% |
| Frequency | Monthly |
| Adjustment | Seasonally Adjusted Annual Rate |
| Download Source File |
Historical Data
| Date | Value |
|---|---|
| August 31, 2018 | 16.72M |
| July 31, 2018 | 16.77M |
| June 30, 2018 | 17.24M |
| May 31, 2018 | 17.19M |
| April 30, 2018 | 17.13M |
| March 31, 2018 | 17.28M |
| February 28, 2018 | 17.01M |
| January 31, 2018 | 17.19M |
| December 31, 2017 | 17.43M |
| November 30, 2017 | 17.64M |
| October 31, 2017 | 17.96M |
| September 30, 2017 | 18.16M |
| August 31, 2017 | 16.58M |
| July 31, 2017 | 16.78M |
| June 30, 2017 | 16.70M |
| May 31, 2017 | 16.79M |
| April 30, 2017 | 17.04M |
| March 31, 2017 | 16.82M |
| February 28, 2017 | 17.45M |
| January 31, 2017 | 17.44M |
| December 31, 2016 | 18.16M |
| November 30, 2016 | 17.71M |
| October 31, 2016 | 17.87M |
| September 30, 2016 | 17.72M |
| August 31, 2016 | 17.22M |
| Date | Value |
|---|---|
| July 31, 2016 | 17.82M |
| June 30, 2016 | 16.80M |
| May 31, 2016 | 17.17M |
| April 30, 2016 | 17.40M |
| March 31, 2016 | 16.67M |
| February 29, 2016 | 17.69M |
| January 31, 2016 | 17.89M |
| December 31, 2015 | 17.52M |
| November 30, 2015 | 18.25M |
| October 31, 2015 | 18.18M |
| September 30, 2015 | 18.05M |
| August 31, 2015 | 17.78M |
| July 31, 2015 | 17.59M |
| June 30, 2015 | 17.00M |
| May 31, 2015 | 17.70M |
| April 30, 2015 | 16.75M |
| March 31, 2015 | 17.14M |
| February 28, 2015 | 16.40M |
| January 31, 2015 | 16.72M |
| December 31, 2014 | 16.92M |
| November 30, 2014 | 17.13M |
| October 31, 2014 | 16.58M |
| September 30, 2014 | 16.52M |
| August 31, 2014 | 17.32M |
| July 31, 2014 | 16.53M |
News
Headline
Time (ET)
05/12 07:21
05/01 13:23
04/24 08:58
04/23 08:36
04/23 06:53
Basic Info
|
US Light Vehicle Retail Sales is at a current level of 16.72M, down from 16.77M last month and up from 16.58M one year ago. This is a change of -0.30% from last month and 0.84% from one year ago. |
| Report | Motor Intelligence Light Vehicle Retail Sales |
| Category | Retail and Services Business Statistics |
| Region | United States |
| Source | Motor Intelligence |
Stats
| Last Value | 16.72M |
| Latest Period | Aug 2018 |
| Last Updated | Sep 6 2018, 13:39 EDT |
| Next Release | Nov 1 2018, 10:30 EDT (E) |
| Average Growth Rate | 7.74% |
| Value from Last Month | 16.77M |
| Change from Last Month | -0.30% |
| Value from 1 Year Ago | 16.58M |
| Change from 1 Year Ago | 0.84% |
| Frequency | Monthly |
| Adjustment | Seasonally Adjusted Annual Rate |
| Download Source File |