

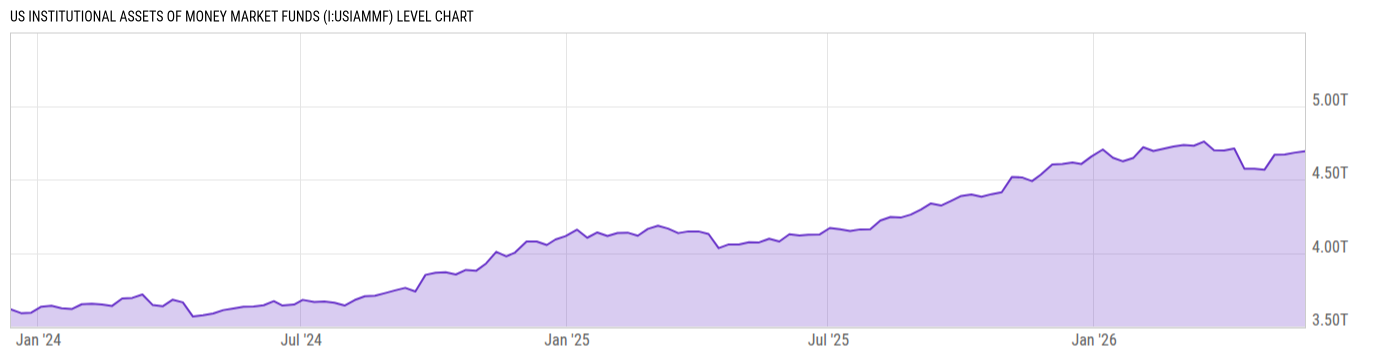
US Institutional Assets of Money Market Funds (I:USIAMMF)
4.692T USD for Wk of May 27 2026
Level Chart
Basic Info
|
US Institutional Assets of Money Market Funds is at a current level of 4.692T, up from 4.683T last week and up from 4.097T one year ago. This is a change of 0.20% from last week and 14.53% from one year ago. |
| Report | Weekly Money Market Mutual Fund Assets |
| Category | Financial Sector Statistics |
| Region | United States |
| Source | Investment Company Institute |
Stats
| Last Value | 4.692T |
| Latest Period | May 27 2026 |
| Last Updated | May 29 2026, 10:08 EDT |
| Next Release | Jun 4 2026, 16:15 EDT (E) |
| Average Growth Rate | 10.78% |
| Value from Last Week | 4.683T |
| Change from Last Week | 0.20% |
| Value from 1 Year Ago | 4.097T |
| Change from 1 Year Ago | 14.53% |
| Frequency | Weekly |
| Unit | USD |
| Adjustment | N/A |
| Download Source File | |
| Notes | Institutional money market fund shares are sold primarily to institutional investors or institutional accounts. This also includes accounts that are purchased by or through an institution such as an employer, trustee, or fiduciary on behalf of its clients, employees, or owners; employer-sponsored retirement plans; and certain qualified individual investors, which includes high net worth individuals and fee-based or wrap account participants. These funds do not limit all beneficial owners of the fund to natural persons. |
Historical Data
| Date | Value |
|---|---|
| May 27, 2026 | 4.692T |
| May 20, 2026 | 4.683T |
| May 13, 2026 | 4.670T |
| May 06, 2026 | 4.669T |
| April 29, 2026 | 4.567T |
| April 22, 2026 | 4.573T |
| April 15, 2026 | 4.574T |
| April 08, 2026 | 4.711T |
| April 01, 2026 | 4.697T |
| March 25, 2026 | 4.699T |
| March 18, 2026 | 4.758T |
| March 11, 2026 | 4.730T |
| March 04, 2026 | 4.735T |
| February 25, 2026 | 4.725T |
| February 18, 2026 | 4.709T |
| February 11, 2026 | 4.694T |
| February 04, 2026 | 4.719T |
| January 28, 2026 | 4.646T |
| January 21, 2026 | 4.624T |
| January 14, 2026 | 4.648T |
| January 07, 2026 | 4.704T |
| December 30, 2025 | 4.656T |
| December 23, 2025 | 4.605T |
| December 17, 2025 | 4.615T |
| December 10, 2025 | 4.606T |
| Date | Value |
|---|---|
| December 03, 2025 | 4.602T |
| November 25, 2025 | 4.533T |
| November 19, 2025 | 4.489T |
| November 12, 2025 | 4.514T |
| November 05, 2025 | 4.516T |
| October 29, 2025 | 4.414T |
| October 22, 2025 | 4.400T |
| October 15, 2025 | 4.382T |
| October 08, 2025 | 4.398T |
| October 01, 2025 | 4.388T |
| September 24, 2025 | 4.355T |
| September 17, 2025 | 4.323T |
| September 10, 2025 | 4.337T |
| September 03, 2025 | 4.295T |
| August 27, 2025 | 4.261T |
| August 20, 2025 | 4.241T |
| August 13, 2025 | 4.245T |
| August 06, 2025 | 4.222T |
| July 30, 2025 | 4.162T |
| July 23, 2025 | 4.161T |
| July 16, 2025 | 4.150T |
| July 09, 2025 | 4.161T |
| July 02, 2025 | 4.170T |
| June 25, 2025 | 4.126T |
| June 17, 2025 | 4.124T |
News
Headline
Time (ET)
Basic Info
|
US Institutional Assets of Money Market Funds is at a current level of 4.692T, up from 4.683T last week and up from 4.097T one year ago. This is a change of 0.20% from last week and 14.53% from one year ago. |
| Report | Weekly Money Market Mutual Fund Assets |
| Category | Financial Sector Statistics |
| Region | United States |
| Source | Investment Company Institute |
Stats
| Last Value | 4.692T |
| Latest Period | May 27 2026 |
| Last Updated | May 29 2026, 10:08 EDT |
| Next Release | Jun 4 2026, 16:15 EDT (E) |
| Average Growth Rate | 10.78% |
| Value from Last Week | 4.683T |
| Change from Last Week | 0.20% |
| Value from 1 Year Ago | 4.097T |
| Change from 1 Year Ago | 14.53% |
| Frequency | Weekly |
| Unit | USD |
| Adjustment | N/A |
| Download Source File | |
| Notes | Institutional money market fund shares are sold primarily to institutional investors or institutional accounts. This also includes accounts that are purchased by or through an institution such as an employer, trustee, or fiduciary on behalf of its clients, employees, or owners; employer-sponsored retirement plans; and certain qualified individual investors, which includes high net worth individuals and fee-based or wrap account participants. These funds do not limit all beneficial owners of the fund to natural persons. |