

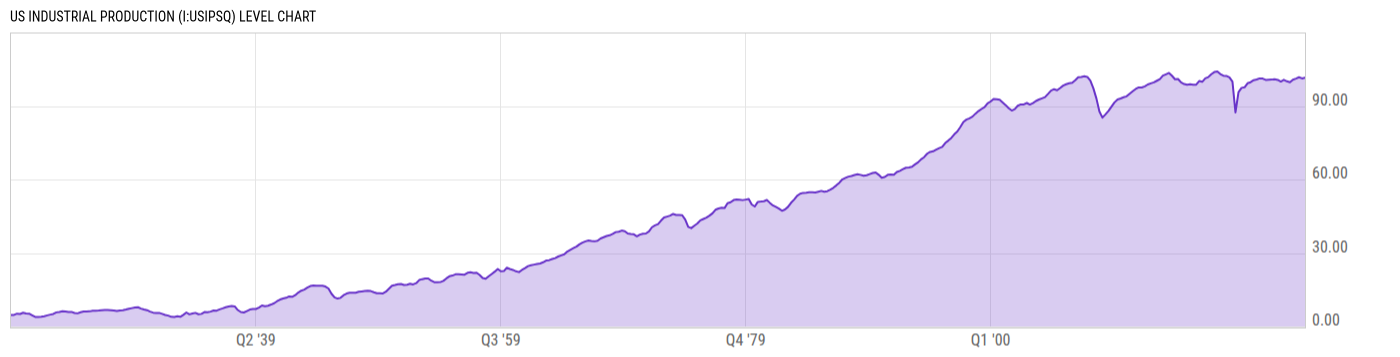
US Industrial Production (I:USIPSQ)
101.57 for Q1 2026
Level Chart
Basic Info
|
US Industrial Production is at a current level of 101.57, up from 101.25 last quarter and up from 100.73 one year ago. This is a change of 0.31% from last quarter and 0.83% from one year ago. |
| Report | G.17 Industrial Production and Capacity Utilization |
| Category | Manufacturing Business Statistics |
| Region | United States |
| Source | Federal Reserve |
Stats
| Last Value | 101.57 |
| Latest Period | Mar 2026 |
| Last Updated | Jun 16 2026, 10:01 EDT |
| Next Release | Jul 17 2026, 10:00 EDT |
| Average Growth Rate | 3.19% |
| Value from Last Quarter | 101.25 |
| Change from Last Quarter | 0.31% |
| Value from 1 Year Ago | 100.73 |
| Change from 1 Year Ago | 0.83% |
| Frequency | Quarterly |
| Unit | Index 2017=100 |
| Adjustment | Seasonally Adjusted |
| Download Source File |
Historical Data
| Date | Value |
|---|---|
| March 31, 2026 | 101.57 |
| December 31, 2025 | 101.25 |
| September 30, 2025 | 101.73 |
| June 30, 2025 | 101.19 |
| March 31, 2025 | 100.73 |
| December 31, 2024 | 99.70 |
| September 30, 2024 | 100.07 |
| June 30, 2024 | 100.67 |
| March 31, 2024 | 99.99 |
| December 31, 2023 | 100.65 |
| September 30, 2023 | 100.92 |
| June 30, 2023 | 100.77 |
| March 31, 2023 | 100.72 |
| December 31, 2022 | 100.66 |
| September 30, 2022 | 101.20 |
| June 30, 2022 | 101.26 |
| March 31, 2022 | 100.79 |
| December 31, 2021 | 100.54 |
| September 30, 2021 | 99.72 |
| June 30, 2021 | 99.26 |
| March 31, 2021 | 97.63 |
| December 31, 2020 | 97.39 |
| September 30, 2020 | 95.65 |
| June 30, 2020 | 87.37 |
| March 31, 2020 | 99.94 |
| Date | Value |
|---|---|
| December 31, 2019 | 101.69 |
| September 30, 2019 | 102.29 |
| June 30, 2019 | 102.37 |
| March 31, 2019 | 103.04 |
| December 31, 2018 | 104.05 |
| September 30, 2018 | 103.83 |
| June 30, 2018 | 102.98 |
| March 31, 2018 | 101.79 |
| December 31, 2017 | 101.25 |
| September 30, 2017 | 99.86 |
| June 30, 2017 | 100.17 |
| March 31, 2017 | 98.71 |
| December 31, 2016 | 98.71 |
| September 30, 2016 | 98.86 |
| June 30, 2016 | 98.65 |
| March 31, 2016 | 98.97 |
| December 31, 2015 | 99.61 |
| September 30, 2015 | 101.00 |
| June 30, 2015 | 100.93 |
| March 31, 2015 | 102.34 |
| December 31, 2014 | 103.50 |
| September 30, 2014 | 102.93 |
| June 30, 2014 | 102.37 |
| March 31, 2014 | 100.99 |
| December 31, 2013 | 100.31 |
News
Headline
Time (ET)
06/01 11:11
Basic Info
|
US Industrial Production is at a current level of 101.57, up from 101.25 last quarter and up from 100.73 one year ago. This is a change of 0.31% from last quarter and 0.83% from one year ago. |
| Report | G.17 Industrial Production and Capacity Utilization |
| Category | Manufacturing Business Statistics |
| Region | United States |
| Source | Federal Reserve |
Stats
| Last Value | 101.57 |
| Latest Period | Mar 2026 |
| Last Updated | Jun 16 2026, 10:01 EDT |
| Next Release | Jul 17 2026, 10:00 EDT |
| Average Growth Rate | 3.19% |
| Value from Last Quarter | 101.25 |
| Change from Last Quarter | 0.31% |
| Value from 1 Year Ago | 100.73 |
| Change from 1 Year Ago | 0.83% |
| Frequency | Quarterly |
| Unit | Index 2017=100 |
| Adjustment | Seasonally Adjusted |
| Download Source File |