

US Industrial Production: General Business Supplies (I:USIPGBSM)
92.62 for Apr 2026
Level Chart
Basic Info
|
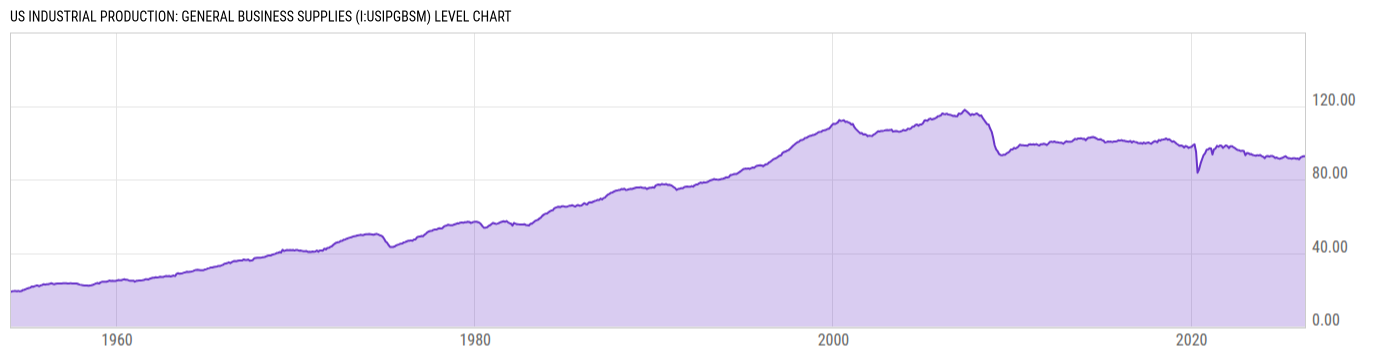
US Industrial Production: General Business Supplies is at a current level of 92.62, down from 92.68 last month and up from 91.94 one year ago. This is a change of -0.07% from last month and 0.74% from one year ago. |
| Report | G.17 Industrial Production and Capacity Utilization |
| Category | Manufacturing Business Statistics |
| Region | United States |
| Source | Federal Reserve |
Stats
| Last Value | 92.62 |
| Latest Period | Apr 2026 |
| Last Updated | May 15 2026, 10:53 EDT |
| Next Release | Jun 15 2026, 10:00 EDT |
| Average Growth Rate | 2.25% |
| Value from Last Month | 92.68 |
| Change from Last Month | -0.07% |
| Value from 1 Year Ago | 91.94 |
| Change from 1 Year Ago | 0.74% |
| Frequency | Monthly |
| Unit | Index 2017=100 |
| Adjustment | Seasonally Adjusted |
| Download Source File |
Historical Data
| Date | Value |
|---|---|
| April 30, 2026 | 92.62 |
| March 31, 2026 | 92.68 |
| February 28, 2026 | 92.36 |
| January 31, 2026 | 92.02 |
| December 31, 2025 | 91.01 |
| November 30, 2025 | 91.45 |
| October 31, 2025 | 91.30 |
| September 30, 2025 | 91.61 |
| August 31, 2025 | 91.55 |
| July 31, 2025 | 91.32 |
| June 30, 2025 | 91.50 |
| May 31, 2025 | 91.56 |
| April 30, 2025 | 91.94 |
| March 31, 2025 | 92.65 |
| February 28, 2025 | 92.29 |
| January 31, 2025 | 91.83 |
| December 31, 2024 | 91.61 |
| November 30, 2024 | 91.24 |
| October 31, 2024 | 91.50 |
| September 30, 2024 | 91.97 |
| August 31, 2024 | 91.71 |
| July 31, 2024 | 92.44 |
| June 30, 2024 | 92.77 |
| May 31, 2024 | 92.78 |
| April 30, 2024 | 92.40 |
| Date | Value |
|---|---|
| March 31, 2024 | 92.77 |
| February 29, 2024 | 92.67 |
| January 31, 2024 | 91.60 |
| December 31, 2023 | 92.34 |
| November 30, 2023 | 92.76 |
| October 31, 2023 | 93.30 |
| September 30, 2023 | 93.11 |
| August 31, 2023 | 93.26 |
| July 31, 2023 | 92.91 |
| June 30, 2023 | 93.13 |
| May 31, 2023 | 93.31 |
| April 30, 2023 | 93.84 |
| March 31, 2023 | 93.78 |
| February 28, 2023 | 94.33 |
| January 31, 2023 | 94.43 |
| December 31, 2022 | 93.22 |
| November 30, 2022 | 95.50 |
| October 31, 2022 | 95.70 |
| September 30, 2022 | 95.49 |
| August 31, 2022 | 95.89 |
| July 31, 2022 | 96.06 |
| June 30, 2022 | 96.44 |
| May 31, 2022 | 97.13 |
| April 30, 2022 | 97.58 |
| March 31, 2022 | 98.12 |
News
Headline
Time (ET)
05/13 17:00
05/13 15:57
05/01 12:49
Basic Info
|
US Industrial Production: General Business Supplies is at a current level of 92.62, down from 92.68 last month and up from 91.94 one year ago. This is a change of -0.07% from last month and 0.74% from one year ago. |
| Report | G.17 Industrial Production and Capacity Utilization |
| Category | Manufacturing Business Statistics |
| Region | United States |
| Source | Federal Reserve |
Stats
| Last Value | 92.62 |
| Latest Period | Apr 2026 |
| Last Updated | May 15 2026, 10:53 EDT |
| Next Release | Jun 15 2026, 10:00 EDT |
| Average Growth Rate | 2.25% |
| Value from Last Month | 92.68 |
| Change from Last Month | -0.07% |
| Value from 1 Year Ago | 91.94 |
| Change from 1 Year Ago | 0.74% |
| Frequency | Monthly |
| Unit | Index 2017=100 |
| Adjustment | Seasonally Adjusted |
| Download Source File |