

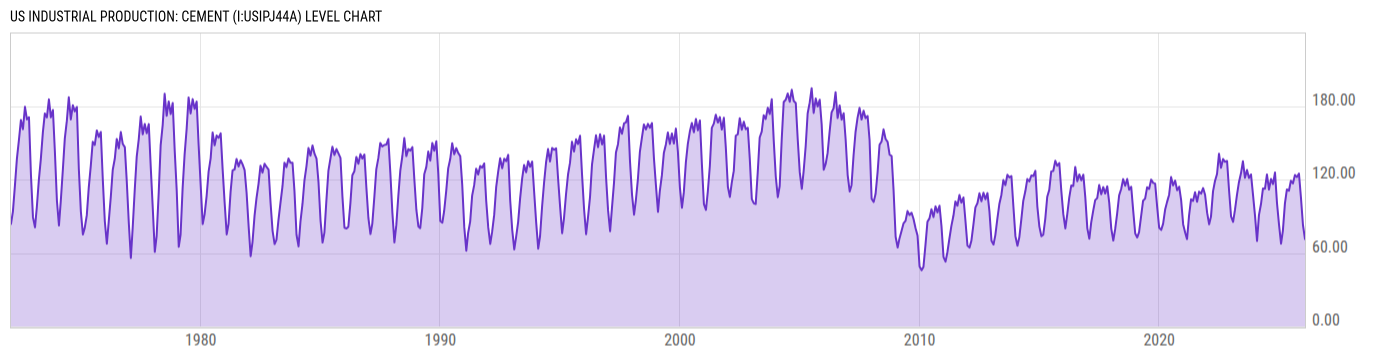
US Industrial Production: Cement (I:USIPJ44A)
71.34 for Jan 2026
Level Chart
Basic Info
|
US Industrial Production: Cement is at a current level of 71.34, down from 82.87 last month and up from 67.64 one year ago. This is a change of -13.91% from last month and 5.46% from one year ago. |
| Report | G.17 Industrial Production and Capacity Utilization |
| Category | Manufacturing Business Statistics |
| Region | United States |
| Source | Federal Reserve |
Stats
| Last Value | 71.34 |
| Latest Period | Jan 2026 |
| Last Updated | May 15 2026, 10:34 EDT |
| Next Release | Jun 15 2026, 10:00 EDT |
| Average Growth Rate | 13.19% |
| Value from Last Month | 82.87 |
| Change from Last Month | -13.91% |
| Value from 1 Year Ago | 67.64 |
| Change from 1 Year Ago | 5.46% |
| Frequency | Monthly |
| Unit | Index 2017=100 |
| Adjustment | Not Seasonally Adjusted |
| Download Source File |
Historical Data
| Date | Value |
|---|---|
| January 31, 2026 | 71.34 |
| December 31, 2025 | 82.87 |
| November 30, 2025 | 105.45 |
| October 31, 2025 | 124.85 |
| September 30, 2025 | 121.94 |
| August 31, 2025 | 123.63 |
| July 31, 2025 | 116.79 |
| June 30, 2025 | 118.93 |
| May 31, 2025 | 110.82 |
| April 30, 2025 | 111.90 |
| March 31, 2025 | 100.46 |
| February 28, 2025 | 78.32 |
| January 31, 2025 | 67.64 |
| December 31, 2024 | 83.15 |
| November 30, 2024 | 100.80 |
| October 31, 2024 | 125.70 |
| September 30, 2024 | 116.28 |
| August 31, 2024 | 120.46 |
| July 31, 2024 | 111.80 |
| June 30, 2024 | 124.08 |
| May 31, 2024 | 112.47 |
| April 30, 2024 | 112.61 |
| March 31, 2024 | 99.97 |
| February 29, 2024 | 90.91 |
| January 31, 2024 | 69.85 |
| Date | Value |
|---|---|
| December 31, 2023 | 90.47 |
| November 30, 2023 | 107.92 |
| October 31, 2023 | 124.12 |
| September 30, 2023 | 121.15 |
| August 31, 2023 | 127.83 |
| July 31, 2023 | 121.37 |
| June 30, 2023 | 134.88 |
| May 31, 2023 | 125.07 |
| April 30, 2023 | 117.78 |
| March 31, 2023 | 107.52 |
| February 28, 2023 | 94.94 |
| January 31, 2023 | 85.36 |
| December 31, 2022 | 89.80 |
| November 30, 2022 | 111.43 |
| October 31, 2022 | 135.15 |
| September 30, 2022 | 134.45 |
| August 31, 2022 | 136.69 |
| July 31, 2022 | 129.56 |
| June 30, 2022 | 141.01 |
| May 31, 2022 | 124.48 |
| April 30, 2022 | 118.81 |
| March 31, 2022 | 110.32 |
| February 28, 2022 | 89.70 |
| January 31, 2022 | 83.39 |
| December 31, 2021 | 92.90 |
News
Headline
Time (ET)
05/13 17:00
05/13 15:57
05/01 12:49
04/23 08:36
Basic Info
|
US Industrial Production: Cement is at a current level of 71.34, down from 82.87 last month and up from 67.64 one year ago. This is a change of -13.91% from last month and 5.46% from one year ago. |
| Report | G.17 Industrial Production and Capacity Utilization |
| Category | Manufacturing Business Statistics |
| Region | United States |
| Source | Federal Reserve |
Stats
| Last Value | 71.34 |
| Latest Period | Jan 2026 |
| Last Updated | May 15 2026, 10:34 EDT |
| Next Release | Jun 15 2026, 10:00 EDT |
| Average Growth Rate | 13.19% |
| Value from Last Month | 82.87 |
| Change from Last Month | -13.91% |
| Value from 1 Year Ago | 67.64 |
| Change from 1 Year Ago | 5.46% |
| Frequency | Monthly |
| Unit | Index 2017=100 |
| Adjustment | Not Seasonally Adjusted |
| Download Source File |