

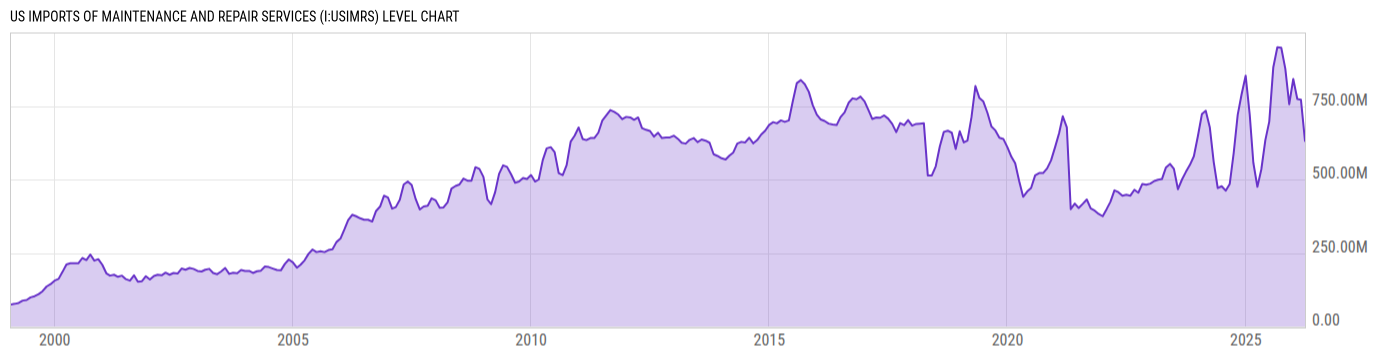
US Imports of Maintenance and Repair Services (I:USIMRS)
631.00M USD for Mar 2026
Level Chart
Basic Info
|
US Imports of Maintenance and Repair Services is at a current level of 631.00M, down from 771.00M last month and up from 475.00M one year ago. This is a change of -18.16% from last month and 32.84% from one year ago. |
| Region | United States |
| Source | Bureau of Economic Analysis |
Stats
| Last Value | 631.00M |
| Latest Period | Mar 2026 |
| Last Updated | May 5 2026, 10:33 EDT |
| Next Release | Jun 9 2026, 08:30 EDT |
| Average Growth Rate | 10.97% |
| Value from Last Month | 771.00M |
| Change from Last Month | -18.16% |
| Value from 1 Year Ago | 475.00M |
| Change from 1 Year Ago | 32.84% |
| Frequency | Monthly |
| Unit | USD |
| Adjustment | Seasonally Adjusted |
| Download Source File |
Historical Data
| Date | Value |
|---|---|
| March 31, 2026 | 631.00M |
| February 28, 2026 | 771.00M |
| January 31, 2026 | 774.00M |
| December 31, 2025 | 842.00M |
| November 30, 2025 | 756.00M |
| October 31, 2025 | 877.00M |
| September 30, 2025 | 948.00M |
| August 31, 2025 | 950.00M |
| July 31, 2025 | 882.00M |
| June 30, 2025 | 697.00M |
| May 31, 2025 | 634.00M |
| April 30, 2025 | 534.00M |
| March 31, 2025 | 475.00M |
| February 28, 2025 | 557.00M |
| January 31, 2025 | 722.00M |
| December 31, 2024 | 853.00M |
| November 30, 2024 | 790.00M |
| October 31, 2024 | 720.00M |
| September 30, 2024 | 589.00M |
| August 31, 2024 | 485.00M |
| July 31, 2024 | 462.00M |
| June 30, 2024 | 477.00M |
| May 31, 2024 | 471.00M |
| April 30, 2024 | 560.00M |
| March 31, 2024 | 678.00M |
| Date | Value |
|---|---|
| February 29, 2024 | 734.00M |
| January 31, 2024 | 723.00M |
| December 31, 2023 | 648.00M |
| November 30, 2023 | 579.00M |
| October 31, 2023 | 550.00M |
| September 30, 2023 | 526.00M |
| August 31, 2023 | 500.00M |
| July 31, 2023 | 467.00M |
| June 30, 2023 | 536.00M |
| May 31, 2023 | 553.00M |
| April 30, 2023 | 541.00M |
| March 31, 2023 | 502.00M |
| February 28, 2023 | 499.00M |
| January 31, 2023 | 495.00M |
| December 31, 2022 | 486.00M |
| November 30, 2022 | 482.00M |
| October 31, 2022 | 485.00M |
| September 30, 2022 | 455.00M |
| August 31, 2022 | 465.00M |
| July 31, 2022 | 445.00M |
| June 30, 2022 | 448.00M |
| May 31, 2022 | 445.00M |
| April 30, 2022 | 457.00M |
| March 31, 2022 | 463.00M |
| February 28, 2022 | 424.00M |
News
Headline
Time (ET)
05/06 07:03
05/05 09:00
05/05 08:52
05/05 07:37
05/04 09:46
Basic Info
|
US Imports of Maintenance and Repair Services is at a current level of 631.00M, down from 771.00M last month and up from 475.00M one year ago. This is a change of -18.16% from last month and 32.84% from one year ago. |
| Region | United States |
| Source | Bureau of Economic Analysis |
Stats
| Last Value | 631.00M |
| Latest Period | Mar 2026 |
| Last Updated | May 5 2026, 10:33 EDT |
| Next Release | Jun 9 2026, 08:30 EDT |
| Average Growth Rate | 10.97% |
| Value from Last Month | 771.00M |
| Change from Last Month | -18.16% |
| Value from 1 Year Ago | 475.00M |
| Change from 1 Year Ago | 32.84% |
| Frequency | Monthly |
| Unit | USD |
| Adjustment | Seasonally Adjusted |
| Download Source File |