

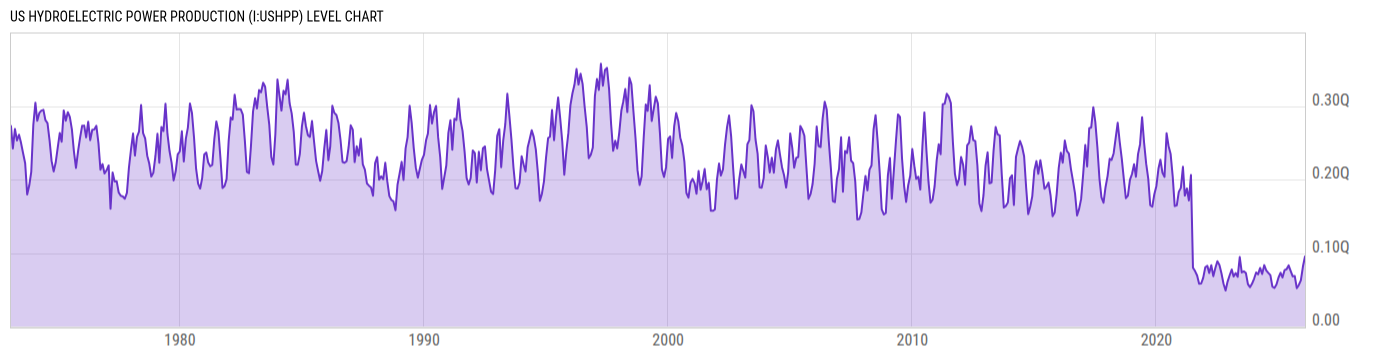
US Hydroelectric Power Production (I:USHPP)
0.0952Q Btu for Jan 2026
Level Chart
Basic Info
|
US Hydroelectric Power Production is at a current level of 0.0952Q, up from 0.0816Q last month and up from 0.0731Q one year ago. This is a change of 16.68% from last month and 30.27% from one year ago. |
| Report | Monthly Energy Review |
| Category | Energy |
| Region | United States |
| Source | Energy Information Administration |
Stats
| Last Value | 0.0952Q |
| Latest Period | Jan 2026 |
| Last Updated | Apr 27 2026, 18:15 EDT |
| Next Release | May 26 2026, 14:00 EDT |
| Average Growth Rate | 7.37% |
| Value from Last Month | 0.0816Q |
| Change from Last Month | 16.68% |
| Value from 1 Year Ago | 0.0731Q |
| Change from 1 Year Ago | 30.27% |
| Frequency | Monthly |
| Unit | British thermal units |
| Adjustment | N/A |
| Download Source File |
Historical Data
| Date | Value |
|---|---|
| January 31, 2026 | 0.0952Q |
| December 31, 2025 | 0.0816Q |
| November 30, 2025 | 0.0628Q |
| October 31, 2025 | 0.0565Q |
| September 30, 2025 | 0.0522Q |
| August 31, 2025 | 0.0686Q |
| July 31, 2025 | 0.0682Q |
| June 30, 2025 | 0.0756Q |
| May 31, 2025 | 0.0831Q |
| April 30, 2025 | 0.0779Q |
| March 31, 2025 | 0.0766Q |
| February 28, 2025 | 0.0667Q |
| January 31, 2025 | 0.0731Q |
| December 31, 2024 | 0.0667Q |
| November 30, 2024 | 0.0571Q |
| October 31, 2024 | 0.0524Q |
| September 30, 2024 | 0.0543Q |
| August 31, 2024 | 0.0699Q |
| July 31, 2024 | 0.073Q |
| June 30, 2024 | 0.0764Q |
| May 31, 2024 | 0.0835Q |
| April 30, 2024 | 0.0714Q |
| March 31, 2024 | 0.0797Q |
| February 29, 2024 | 0.0709Q |
| January 31, 2024 | 0.0735Q |
| Date | Value |
|---|---|
| December 31, 2023 | 0.0649Q |
| November 30, 2023 | 0.0581Q |
| October 31, 2023 | 0.0535Q |
| September 30, 2023 | 0.0577Q |
| August 31, 2023 | 0.0727Q |
| July 31, 2023 | 0.075Q |
| June 30, 2023 | 0.0736Q |
| May 31, 2023 | 0.0944Q |
| April 30, 2023 | 0.0676Q |
| March 31, 2023 | 0.0728Q |
| February 28, 2023 | 0.0681Q |
| January 31, 2023 | 0.0776Q |
| December 31, 2022 | 0.0697Q |
| November 30, 2022 | 0.0611Q |
| October 31, 2022 | 0.049Q |
| September 30, 2022 | 0.0581Q |
| August 31, 2022 | 0.0721Q |
| July 31, 2022 | 0.0838Q |
| June 30, 2022 | 0.0887Q |
| May 31, 2022 | 0.0797Q |
| April 30, 2022 | 0.0685Q |
| March 31, 2022 | 0.0834Q |
| February 28, 2022 | 0.0727Q |
| January 31, 2022 | 0.0826Q |
| December 31, 2021 | 0.0804Q |
News
Headline
Time (ET)
05/22 15:56
05/12 15:59
Basic Info
|
US Hydroelectric Power Production is at a current level of 0.0952Q, up from 0.0816Q last month and up from 0.0731Q one year ago. This is a change of 16.68% from last month and 30.27% from one year ago. |
| Report | Monthly Energy Review |
| Category | Energy |
| Region | United States |
| Source | Energy Information Administration |
Stats
| Last Value | 0.0952Q |
| Latest Period | Jan 2026 |
| Last Updated | Apr 27 2026, 18:15 EDT |
| Next Release | May 26 2026, 14:00 EDT |
| Average Growth Rate | 7.37% |
| Value from Last Month | 0.0816Q |
| Change from Last Month | 16.68% |
| Value from 1 Year Ago | 0.0731Q |
| Change from 1 Year Ago | 30.27% |
| Frequency | Monthly |
| Unit | British thermal units |
| Adjustment | N/A |
| Download Source File |