

US High Yield Master II Total Return Index Value (I:USHYMIIT)
Level Chart
Basic Info
|
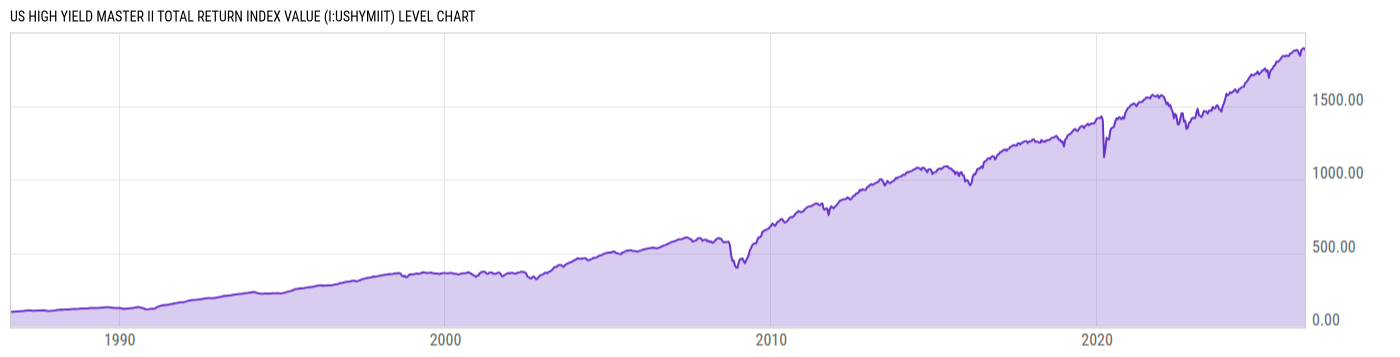
US High Yield Master II Total Return Index Value is at a current level of 1881.63, down from 1882.45 the previous market day and up from 1761.40 one year ago. This is a change of -0.04% from the previous market day and 6.83% from one year ago. |
|
This data represents the ICE BofA US High Yield Index value, which tracks the performance of US dollar denominated below investment grade rated corporate debt publicly issued in the US domestic market. To qualify for inclusion in the index, securities must have a below investment grade rating (based on an average of Moody's, S&P, and Fitch) and an investment grade rated country of risk (based on an average of Moody's, S&P, and Fitch foreign currency long term sovereign debt ratings). Each security must have greater than 1 year of remaining maturity, a fixed coupon schedule, and a minimum amount outstanding of $100 million. Original issue zero coupon bonds, "global" securities (debt issued simultaneously in the eurobond and US domestic bond markets), 144a securities and pay-in-kind securities, including toggle notes, qualify for inclusion in the Index. Callable perpetual securities qualify provided they are at least one year from the first call date. Fixed-to-floating rate securities also qualify provided they are callable within the fixed rate period and are at least one year from the last call prior to the date the bond transitions from a fixed to a floating rate security. DRD-eligible and defaulted securities are excluded from the Index. |
| Report | Bank of America Merrill Lynch |
| Category | Interest Rates |
| Region | United States |
| Source | Bank of America Merrill Lynch |
Stats
| Last Value | 1881.63 |
| Latest Period | May 18 2026 |
| Last Updated | May 19 2026, 11:15 EDT |
| Next Release | May 20 2026, 10:00 EDT |
| Average Growth Rate | 8.01% |
| Value from The Previous Market Day | 1882.45 |
| Change from The Previous Market Day | -0.04% |
| Value from 1 Year Ago | 1761.40 |
| Change from 1 Year Ago | 6.83% |
| Frequency | Market Daily |
| Adjustment | N/A |
Historical Data
| Date | Value |
|---|---|
| May 18, 2026 | 1881.63 |
| May 15, 2026 | 1882.45 |
| May 14, 2026 | 1889.31 |
| May 13, 2026 | 1887.51 |
| May 12, 2026 | 1886.48 |
| May 11, 2026 | 1891.02 |
| May 08, 2026 | 1891.98 |
| May 07, 2026 | 1891.42 |
| May 06, 2026 | 1894.24 |
| May 05, 2026 | 1889.12 |
| May 04, 2026 | 1888.02 |
| May 01, 2026 | 1891.03 |
| April 30, 2026 | 1888.40 |
| April 29, 2026 | 1886.09 |
| April 28, 2026 | 1889.45 |
| April 27, 2026 | 1891.44 |
| April 24, 2026 | 1890.60 |
| April 23, 2026 | 1889.51 |
| April 22, 2026 | 1891.43 |
| April 21, 2026 | 1890.78 |
| April 20, 2026 | 1893.28 |
| April 17, 2026 | 1894.21 |
| April 16, 2026 | 1888.73 |
| April 15, 2026 | 1889.47 |
| April 14, 2026 | 1889.56 |
| Date | Value |
|---|---|
| April 13, 2026 | 1882.77 |
| April 10, 2026 | 1881.37 |
| April 09, 2026 | 1883.41 |
| April 08, 2026 | 1881.02 |
| April 07, 2026 | 1868.62 |
| April 06, 2026 | 1869.49 |
| April 03, 2026 | 1864.34 |
| April 02, 2026 | 1864.49 |
| April 01, 2026 | 1863.89 |
| March 31, 2026 | 1856.80 |
| March 30, 2026 | 1846.03 |
| March 27, 2026 | 1842.33 |
| March 26, 2026 | 1851.26 |
| March 25, 2026 | 1859.46 |
| March 24, 2026 | 1854.58 |
| March 23, 2026 | 1857.52 |
| March 20, 2026 | 1851.36 |
| March 19, 2026 | 1857.50 |
| March 18, 2026 | 1862.41 |
| March 17, 2026 | 1865.54 |
| March 16, 2026 | 1861.26 |
| March 13, 2026 | 1857.09 |
| March 12, 2026 | 1863.07 |
| March 11, 2026 | 1872.00 |
| March 10, 2026 | 1875.62 |
News
Basic Info
|
US High Yield Master II Total Return Index Value is at a current level of 1881.63, down from 1882.45 the previous market day and up from 1761.40 one year ago. This is a change of -0.04% from the previous market day and 6.83% from one year ago. |
|
This data represents the ICE BofA US High Yield Index value, which tracks the performance of US dollar denominated below investment grade rated corporate debt publicly issued in the US domestic market. To qualify for inclusion in the index, securities must have a below investment grade rating (based on an average of Moody's, S&P, and Fitch) and an investment grade rated country of risk (based on an average of Moody's, S&P, and Fitch foreign currency long term sovereign debt ratings). Each security must have greater than 1 year of remaining maturity, a fixed coupon schedule, and a minimum amount outstanding of $100 million. Original issue zero coupon bonds, "global" securities (debt issued simultaneously in the eurobond and US domestic bond markets), 144a securities and pay-in-kind securities, including toggle notes, qualify for inclusion in the Index. Callable perpetual securities qualify provided they are at least one year from the first call date. Fixed-to-floating rate securities also qualify provided they are callable within the fixed rate period and are at least one year from the last call prior to the date the bond transitions from a fixed to a floating rate security. DRD-eligible and defaulted securities are excluded from the Index. |
| Report | Bank of America Merrill Lynch |
| Category | Interest Rates |
| Region | United States |
| Source | Bank of America Merrill Lynch |
Stats
| Last Value | 1881.63 |
| Latest Period | May 18 2026 |
| Last Updated | May 19 2026, 11:15 EDT |
| Next Release | May 20 2026, 10:00 EDT |
| Average Growth Rate | 8.01% |
| Value from The Previous Market Day | 1882.45 |
| Change from The Previous Market Day | -0.04% |
| Value from 1 Year Ago | 1761.40 |
| Change from 1 Year Ago | 6.83% |
| Frequency | Market Daily |
| Adjustment | N/A |