

US Gross Inputs Used by Refineries (I:USGIUR)
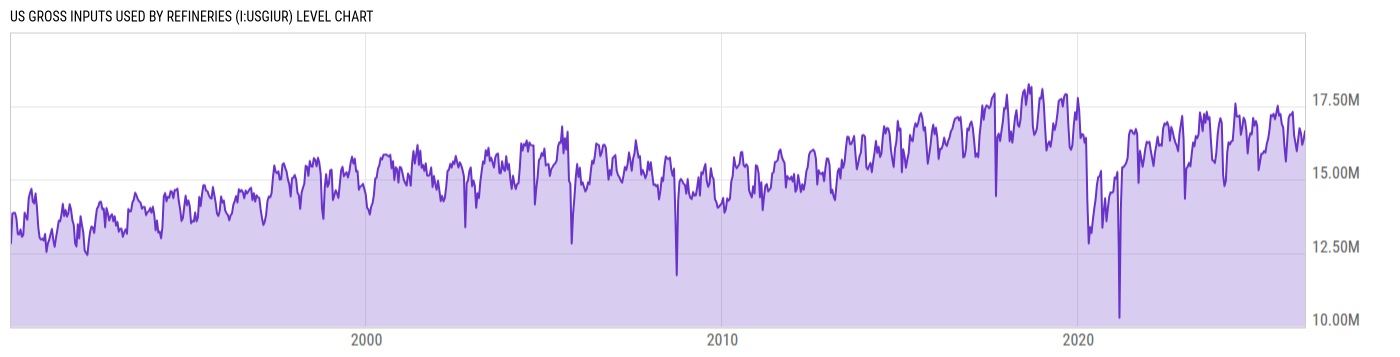
16.64M bbl/d for Wk of May 15 2026
Level Chart
Basic Info
|
US Gross Inputs Used by Refineries is at a current level of 16.64M, down from 16.66M last week and up from 16.61M one year ago. This is a change of -0.11% from last week and 0.19% from one year ago. |
| Report | Weekly Petroleum Status |
| Category | Energy |
| Region | N/A |
| Source | Energy Information Administration |
Stats
| Last Value | 16.64M |
| Latest Period | May 15 2026 |
| Last Updated | May 20 2026, 12:05 EDT |
| Next Release | May 28 2026, 12:00 EDT |
| Average Growth Rate | 1.97% |
| Value from Last Week | 16.66M |
| Change from Last Week | -0.11% |
| Value from 1 Year Ago | 16.61M |
| Change from 1 Year Ago | 0.19% |
| Frequency | Weekly |
| Unit | Barrels per Day |
| Adjustment | N/A |
| Download Source File | |
| Notes | Gross inputs. |
Historical Data
| Date | Value |
|---|---|
| May 15, 2026 | 16.64M |
| May 08, 2026 | 16.66M |
| May 01, 2026 | 16.36M |
| April 24, 2026 | 16.27M |
| April 17, 2026 | 16.18M |
| April 10, 2026 | 16.27M |
| April 03, 2026 | 16.58M |
| March 27, 2026 | 16.59M |
| March 20, 2026 | 16.75M |
| March 13, 2026 | 16.46M |
| March 06, 2026 | 16.37M |
| February 27, 2026 | 16.08M |
| February 20, 2026 | 15.96M |
| February 13, 2026 | 16.40M |
| February 06, 2026 | 16.24M |
| January 30, 2026 | 16.44M |
| January 23, 2026 | 16.51M |
| January 16, 2026 | 16.95M |
| January 09, 2026 | 17.30M |
| January 02, 2026 | 17.20M |
| December 26, 2025 | 17.20M |
| December 19, 2025 | 17.18M |
| December 12, 2025 | 17.21M |
| December 05, 2025 | 17.15M |
| November 28, 2025 | 17.09M |
| Date | Value |
|---|---|
| November 21, 2025 | 16.76M |
| November 14, 2025 | 16.34M |
| November 07, 2025 | 16.24M |
| October 31, 2025 | 15.62M |
| October 24, 2025 | 15.72M |
| October 17, 2025 | 16.09M |
| October 10, 2025 | 15.57M |
| October 03, 2025 | 16.78M |
| September 26, 2025 | 16.60M |
| September 19, 2025 | 16.89M |
| September 12, 2025 | 16.94M |
| September 05, 2025 | 17.23M |
| August 29, 2025 | 17.12M |
| August 22, 2025 | 17.18M |
| August 15, 2025 | 17.53M |
| August 08, 2025 | 17.51M |
| August 01, 2025 | 17.52M |
| July 25, 2025 | 17.26M |
| July 18, 2025 | 17.27M |
| July 11, 2025 | 17.05M |
| July 04, 2025 | 17.20M |
| June 27, 2025 | 17.24M |
| June 20, 2025 | 17.20M |
| June 13, 2025 | 17.15M |
| June 06, 2025 | 17.36M |
News
Headline
Time (ET)
05/21 14:40
05/20 16:03
05/13 14:39
Basic Info
|
US Gross Inputs Used by Refineries is at a current level of 16.64M, down from 16.66M last week and up from 16.61M one year ago. This is a change of -0.11% from last week and 0.19% from one year ago. |
| Report | Weekly Petroleum Status |
| Category | Energy |
| Region | N/A |
| Source | Energy Information Administration |
Stats
| Last Value | 16.64M |
| Latest Period | May 15 2026 |
| Last Updated | May 20 2026, 12:05 EDT |
| Next Release | May 28 2026, 12:00 EDT |
| Average Growth Rate | 1.97% |
| Value from Last Week | 16.66M |
| Change from Last Week | -0.11% |
| Value from 1 Year Ago | 16.61M |
| Change from 1 Year Ago | 0.19% |
| Frequency | Weekly |
| Unit | Barrels per Day |
| Adjustment | N/A |
| Download Source File | |
| Notes | Gross inputs. |