

US Geothermal Energy Production (I:USGEP)
0.0102Q Btu for Jan 2026
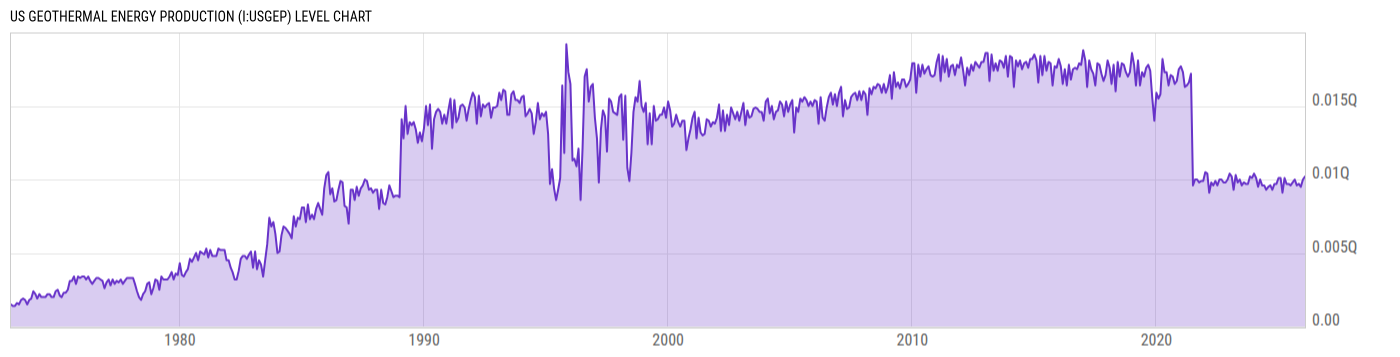
Level Chart
Basic Info
|
US Geothermal Energy Production is at a current level of 0.0102Q, up from 0.0100Q last month and up from 0.0101Q one year ago. This is a change of 2.10% from last month and 1.27% from one year ago. |
| Report | Monthly Energy Review |
| Category | Energy |
| Region | United States |
| Source | Energy Information Administration |
Stats
| Last Value | 0.0102Q |
| Latest Period | Jan 2026 |
| Last Updated | Apr 27 2026, 18:15 EDT |
| Next Release | May 26 2026, 14:00 EDT |
| Average Growth Rate | 9.84% |
| Value from Last Month | 0.0100Q |
| Change from Last Month | 2.10% |
| Value from 1 Year Ago | 0.0101Q |
| Change from 1 Year Ago | 1.27% |
| Frequency | Monthly |
| Unit | British thermal units |
| Adjustment | N/A |
| Download Source File |
Historical Data
| Date | Value |
|---|---|
| January 31, 2026 | 0.0102Q |
| December 31, 2025 | 0.01Q |
| November 30, 2025 | 0.0095Q |
| October 31, 2025 | 0.0097Q |
| September 30, 2025 | 0.0096Q |
| August 31, 2025 | 0.01Q |
| July 31, 2025 | 0.0098Q |
| June 30, 2025 | 0.0096Q |
| May 31, 2025 | 0.0097Q |
| April 30, 2025 | 0.0097Q |
| March 31, 2025 | 0.0101Q |
| February 28, 2025 | 0.0091Q |
| January 31, 2025 | 0.0101Q |
| December 31, 2024 | 0.0101Q |
| November 30, 2024 | 0.0097Q |
| October 31, 2024 | 0.0097Q |
| September 30, 2024 | 0.0093Q |
| August 31, 2024 | 0.0096Q |
| July 31, 2024 | 0.0095Q |
| June 30, 2024 | 0.0093Q |
| May 31, 2024 | 0.0096Q |
| April 30, 2024 | 0.0096Q |
| March 31, 2024 | 0.01Q |
| February 29, 2024 | 0.0095Q |
| January 31, 2024 | 0.0101Q |
| Date | Value |
|---|---|
| December 31, 2023 | 0.0104Q |
| November 30, 2023 | 0.0101Q |
| October 31, 2023 | 0.0102Q |
| September 30, 2023 | 0.0097Q |
| August 31, 2023 | 0.0097Q |
| July 31, 2023 | 0.0098Q |
| June 30, 2023 | 0.0096Q |
| May 31, 2023 | 0.01Q |
| April 30, 2023 | 0.0098Q |
| March 31, 2023 | 0.0103Q |
| February 28, 2023 | 0.0093Q |
| January 31, 2023 | 0.0102Q |
| December 31, 2022 | 0.0104Q |
| November 30, 2022 | 0.01Q |
| October 31, 2022 | 0.0098Q |
| September 30, 2022 | 0.0098Q |
| August 31, 2022 | 0.01Q |
| July 31, 2022 | 0.01Q |
| June 30, 2022 | 0.0096Q |
| May 31, 2022 | 0.0099Q |
| April 30, 2022 | 0.0096Q |
| March 31, 2022 | 0.0098Q |
| February 28, 2022 | 0.0091Q |
| January 31, 2022 | 0.0104Q |
| December 31, 2021 | 0.0105Q |
News
Headline
Time (ET)
04/23 08:36
Basic Info
|
US Geothermal Energy Production is at a current level of 0.0102Q, up from 0.0100Q last month and up from 0.0101Q one year ago. This is a change of 2.10% from last month and 1.27% from one year ago. |
| Report | Monthly Energy Review |
| Category | Energy |
| Region | United States |
| Source | Energy Information Administration |
Stats
| Last Value | 0.0102Q |
| Latest Period | Jan 2026 |
| Last Updated | Apr 27 2026, 18:15 EDT |
| Next Release | May 26 2026, 14:00 EDT |
| Average Growth Rate | 9.84% |
| Value from Last Month | 0.0100Q |
| Change from Last Month | 2.10% |
| Value from 1 Year Ago | 0.0101Q |
| Change from 1 Year Ago | 1.27% |
| Frequency | Monthly |
| Unit | British thermal units |
| Adjustment | N/A |
| Download Source File |