

US GDP Gap (I:USGDPG)
395637.0 for Q1 2026
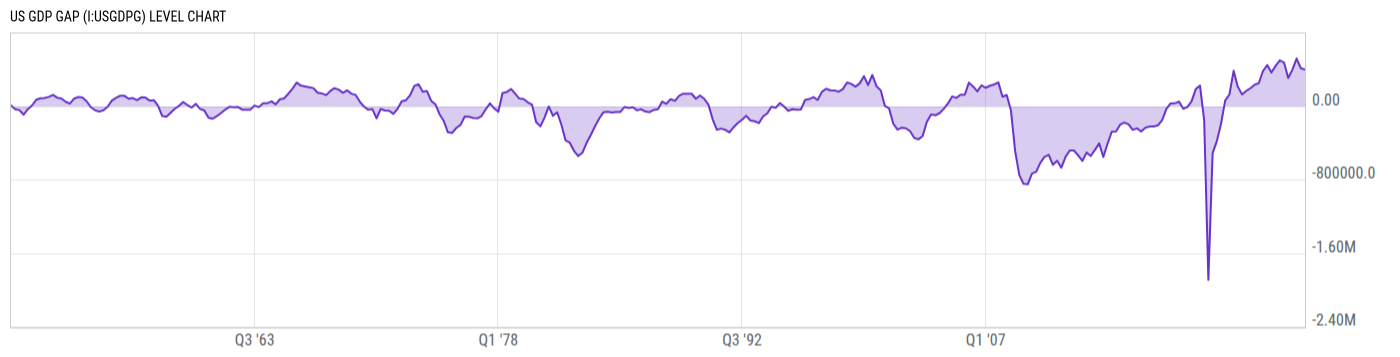
Level Chart
Basic Info
|
US GDP Gap is at a current level of 395637.0, down from 411119.0 last quarter and up from 304990.0 one year ago. This is a change of -3.77% from last quarter and 29.72% from one year ago. |
| Report | Gross Domestic Product (GDP) |
| Category | GDP |
| Region | United States |
| Source | Federal Reserve Bank of St. Louis |
Stats
| Last Value | 395637.0 |
| Latest Period | Mar 2026 |
| Last Updated | Apr 30 2026, 08:45 EDT |
| Average Growth Rate | -112.8% |
| Value from Last Quarter | 411119.0 |
| Change from Last Quarter | -3.77% |
| Value from 1 Year Ago | 304990.0 |
| Change from 1 Year Ago | 29.72% |
| Frequency | Quarterly |
| Adjustment | N/A |
| Notes | Actual Real GDP minus Potential Real GDP. If the GDP gap is greater than 0 it indicates a possible inflationary gap where real GDP is outpacing potential real GDP. If the GDP gap is less than 0 it indicates a possible recessionary gap where potential real GDP is outpacing real GDP. |
| Formula | US Real GDP - US Real Potential GDP |
Historical Data
| Date | Value |
|---|---|
| March 31, 2026 | 395637.0 |
| December 31, 2025 | 411119.0 |
| September 30, 2025 | 516654.0 |
| June 30, 2025 | 394906.0 |
| March 31, 2025 | 304990.0 |
| December 31, 2024 | 473202.0 |
| September 30, 2024 | 497250.0 |
| June 30, 2024 | 436638.0 |
| March 31, 2024 | 363989.0 |
| December 31, 2023 | 445595.4 |
| September 30, 2023 | 381248.3 |
| June 30, 2023 | 247386.6 |
| March 31, 2023 | 231364.5 |
| December 31, 2022 | 193419.6 |
| September 30, 2022 | 164089.9 |
| June 30, 2022 | 126478.6 |
| March 31, 2022 | 210685.2 |
| December 31, 2021 | 382656.2 |
| September 30, 2021 | 124808.8 |
| June 30, 2021 | 58030.65 |
| March 31, 2021 | -195569.2 |
| December 31, 2020 | -382413.3 |
| September 30, 2020 | -512883.6 |
| June 30, 2020 | -1.892M |
| March 31, 2020 | -158064.9 |
| Date | Value |
|---|---|
| December 31, 2019 | 221468.8 |
| September 30, 2019 | 184325.4 |
| June 30, 2019 | 51160.07 |
| March 31, 2019 | -11392.04 |
| December 31, 2018 | -30224.73 |
| September 30, 2018 | 48024.32 |
| June 30, 2018 | 28804.62 |
| March 31, 2018 | 27533.83 |
| December 31, 2017 | -31915.61 |
| September 30, 2017 | -153735.6 |
| June 30, 2017 | -210134.8 |
| March 31, 2017 | -223828.8 |
| December 31, 2016 | -223706.0 |
| September 30, 2016 | -236124.3 |
| June 30, 2016 | -277035.0 |
| March 31, 2016 | -243532.1 |
| December 31, 2015 | -258763.2 |
| September 30, 2015 | -199420.3 |
| June 30, 2015 | -180773.3 |
| March 31, 2015 | -203153.7 |
| December 31, 2014 | -277695.6 |
| September 30, 2014 | -279845.3 |
| June 30, 2014 | -411175.8 |
| March 31, 2014 | -555469.0 |
| December 31, 2013 | -406766.3 |
News
Headline
Time (ET)
04/30 11:18
04/30 09:10
04/30 07:48
04/27 06:23
Basic Info
|
US GDP Gap is at a current level of 395637.0, down from 411119.0 last quarter and up from 304990.0 one year ago. This is a change of -3.77% from last quarter and 29.72% from one year ago. |
| Report | Gross Domestic Product (GDP) |
| Category | GDP |
| Region | United States |
| Source | Federal Reserve Bank of St. Louis |
Stats
| Last Value | 395637.0 |
| Latest Period | Mar 2026 |
| Last Updated | Apr 30 2026, 08:45 EDT |
| Average Growth Rate | -112.8% |
| Value from Last Quarter | 411119.0 |
| Change from Last Quarter | -3.77% |
| Value from 1 Year Ago | 304990.0 |
| Change from 1 Year Ago | 29.72% |
| Frequency | Quarterly |
| Adjustment | N/A |
| Notes | Actual Real GDP minus Potential Real GDP. If the GDP gap is greater than 0 it indicates a possible inflationary gap where real GDP is outpacing potential real GDP. If the GDP gap is less than 0 it indicates a possible recessionary gap where potential real GDP is outpacing real GDP. |
| Formula | US Real GDP - US Real Potential GDP |