

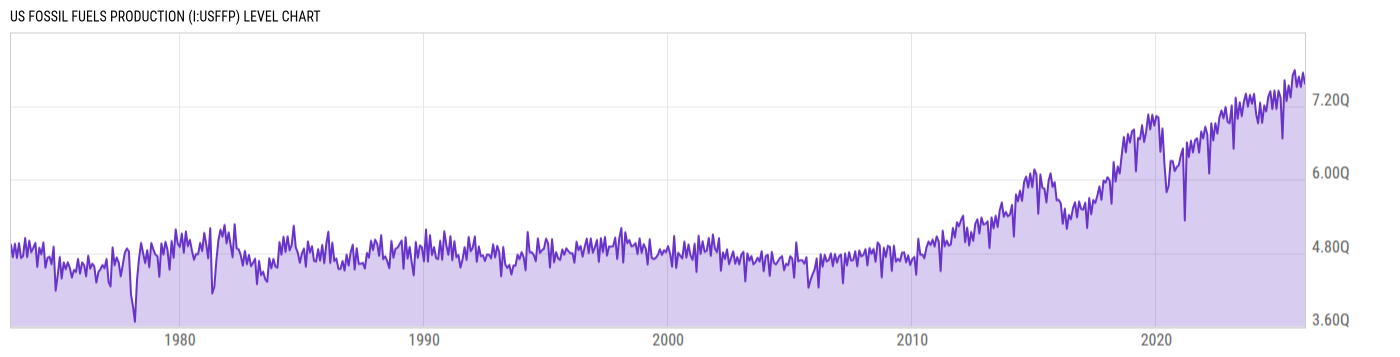
US Fossil Fuels Production (I:USFFP)
7.565Q Btu for Jan 2026
Level Chart
Basic Info
|
US Fossil Fuels Production is at a current level of 7.565Q, down from 7.742Q last month and up from 7.337Q one year ago. This is a change of -2.29% from last month and 3.11% from one year ago. |
| Report | Monthly Energy Review |
| Category | Energy |
| Region | United States |
| Source | Energy Information Administration |
Stats
| Last Value | 7.565Q |
| Latest Period | Jan 2026 |
| Last Updated | Apr 27 2026, 18:15 EDT |
| Next Release | May 26 2026, 14:00 EDT |
| Average Growth Rate | 2.53% |
| Value from Last Month | 7.742Q |
| Change from Last Month | -2.29% |
| Value from 1 Year Ago | 7.337Q |
| Change from 1 Year Ago | 3.11% |
| Frequency | Monthly |
| Unit | British thermal units |
| Adjustment | N/A |
| Download Source File |
Historical Data
| Date | Value |
|---|---|
| January 31, 2026 | 7.565Q |
| December 31, 2025 | 7.742Q |
| November 30, 2025 | 7.509Q |
| October 31, 2025 | 7.679Q |
| September 30, 2025 | 7.51Q |
| August 31, 2025 | 7.787Q |
| July 31, 2025 | 7.702Q |
| June 30, 2025 | 7.341Q |
| May 31, 2025 | 7.533Q |
| April 30, 2025 | 7.278Q |
| March 31, 2025 | 7.621Q |
| February 28, 2025 | 6.669Q |
| January 31, 2025 | 7.337Q |
| December 31, 2024 | 7.448Q |
| November 30, 2024 | 7.151Q |
| October 31, 2024 | 7.452Q |
| September 30, 2024 | 7.150Q |
| August 31, 2024 | 7.442Q |
| July 31, 2024 | 7.349Q |
| June 30, 2024 | 7.112Q |
| May 31, 2024 | 7.207Q |
| April 30, 2024 | 6.926Q |
| March 31, 2024 | 7.253Q |
| February 29, 2024 | 6.916Q |
| January 31, 2024 | 7.071Q |
| Date | Value |
|---|---|
| December 31, 2023 | 7.397Q |
| November 30, 2023 | 7.236Q |
| October 31, 2023 | 7.38Q |
| September 30, 2023 | 7.189Q |
| August 31, 2023 | 7.400Q |
| July 31, 2023 | 7.267Q |
| June 30, 2023 | 7.034Q |
| May 31, 2023 | 7.260Q |
| April 30, 2023 | 6.990Q |
| March 31, 2023 | 7.336Q |
| February 28, 2023 | 6.501Q |
| January 31, 2023 | 7.208Q |
| December 31, 2022 | 6.919Q |
| November 30, 2022 | 6.941Q |
| October 31, 2022 | 7.183Q |
| September 30, 2022 | 6.998Q |
| August 31, 2022 | 7.126Q |
| July 31, 2022 | 7.014Q |
| June 30, 2022 | 6.750Q |
| May 31, 2022 | 6.918Q |
| April 30, 2022 | 6.637Q |
| March 31, 2022 | 6.919Q |
| February 28, 2022 | 6.098Q |
| January 31, 2022 | 6.736Q |
| December 31, 2021 | 6.862Q |
News
Headline
Time (ET)
05/22 15:56
05/12 15:59
Basic Info
|
US Fossil Fuels Production is at a current level of 7.565Q, down from 7.742Q last month and up from 7.337Q one year ago. This is a change of -2.29% from last month and 3.11% from one year ago. |
| Report | Monthly Energy Review |
| Category | Energy |
| Region | United States |
| Source | Energy Information Administration |
Stats
| Last Value | 7.565Q |
| Latest Period | Jan 2026 |
| Last Updated | Apr 27 2026, 18:15 EDT |
| Next Release | May 26 2026, 14:00 EDT |
| Average Growth Rate | 2.53% |
| Value from Last Month | 7.742Q |
| Change from Last Month | -2.29% |
| Value from 1 Year Ago | 7.337Q |
| Change from 1 Year Ago | 3.11% |
| Frequency | Monthly |
| Unit | British thermal units |
| Adjustment | N/A |
| Download Source File |