

US Fossil Fuels Consumption (I:USFFC)
7.783Q Btu for Jan 2026
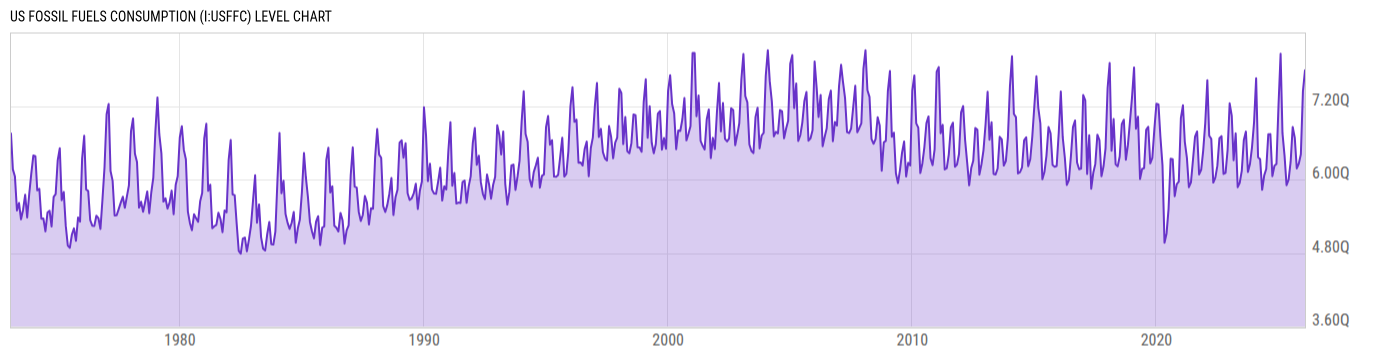
Level Chart
Basic Info
|
US Fossil Fuels Consumption is at a current level of 7.783Q, up from 7.441Q last month and down from 8.052Q one year ago. This is a change of 4.59% from last month and -3.34% from one year ago. |
| Report | Monthly Energy Review |
| Category | Energy |
| Region | United States |
| Source | Energy Information Administration |
Stats
| Last Value | 7.783Q |
| Latest Period | Jan 2026 |
| Last Updated | Apr 27 2026, 18:15 EDT |
| Next Release | May 26 2026, 14:00 EDT |
| Average Growth Rate | 3.35% |
| Value from Last Month | 7.441Q |
| Change from Last Month | 4.59% |
| Value from 1 Year Ago | 8.052Q |
| Change from 1 Year Ago | -3.34% |
| Frequency | Monthly |
| Unit | British thermal units |
| Adjustment | N/A |
| Download Source File |
Historical Data
| Date | Value |
|---|---|
| January 31, 2026 | 7.783Q |
| December 31, 2025 | 7.441Q |
| November 30, 2025 | 6.412Q |
| October 31, 2025 | 6.261Q |
| September 30, 2025 | 6.180Q |
| August 31, 2025 | 6.682Q |
| July 31, 2025 | 6.859Q |
| June 30, 2025 | 6.286Q |
| May 31, 2025 | 5.998Q |
| April 30, 2025 | 5.908Q |
| March 31, 2025 | 6.390Q |
| February 28, 2025 | 6.756Q |
| January 31, 2025 | 8.052Q |
| December 31, 2024 | 7.220Q |
| November 30, 2024 | 6.253Q |
| October 31, 2024 | 6.224Q |
| September 30, 2024 | 6.054Q |
| August 31, 2024 | 6.741Q |
| July 31, 2024 | 6.738Q |
| June 30, 2024 | 6.171Q |
| May 31, 2024 | 6.067Q |
| April 30, 2024 | 5.832Q |
| March 31, 2024 | 6.330Q |
| February 29, 2024 | 6.363Q |
| January 31, 2024 | 7.652Q |
| Date | Value |
|---|---|
| December 31, 2023 | 6.935Q |
| November 30, 2023 | 6.525Q |
| October 31, 2023 | 6.253Q |
| September 30, 2023 | 6.124Q |
| August 31, 2023 | 6.782Q |
| July 31, 2023 | 6.646Q |
| June 30, 2023 | 6.140Q |
| May 31, 2023 | 5.948Q |
| April 30, 2023 | 5.875Q |
| March 31, 2023 | 6.753Q |
| February 28, 2023 | 6.315Q |
| January 31, 2023 | 7.043Q |
| December 31, 2022 | 7.244Q |
| November 30, 2022 | 6.481Q |
| October 31, 2022 | 6.110Q |
| September 30, 2022 | 6.091Q |
| August 31, 2022 | 6.709Q |
| July 31, 2022 | 6.676Q |
| June 30, 2022 | 6.225Q |
| May 31, 2022 | 6.031Q |
| April 30, 2022 | 5.949Q |
| March 31, 2022 | 6.663Q |
| February 28, 2022 | 6.715Q |
| January 31, 2022 | 7.622Q |
| December 31, 2021 | 6.924Q |
News
Headline
Time (ET)
05/12 15:59
Basic Info
|
US Fossil Fuels Consumption is at a current level of 7.783Q, up from 7.441Q last month and down from 8.052Q one year ago. This is a change of 4.59% from last month and -3.34% from one year ago. |
| Report | Monthly Energy Review |
| Category | Energy |
| Region | United States |
| Source | Energy Information Administration |
Stats
| Last Value | 7.783Q |
| Latest Period | Jan 2026 |
| Last Updated | Apr 27 2026, 18:15 EDT |
| Next Release | May 26 2026, 14:00 EDT |
| Average Growth Rate | 3.35% |
| Value from Last Month | 7.441Q |
| Change from Last Month | 4.59% |
| Value from 1 Year Ago | 8.052Q |
| Change from 1 Year Ago | -3.34% |
| Frequency | Monthly |
| Unit | British thermal units |
| Adjustment | N/A |
| Download Source File |