

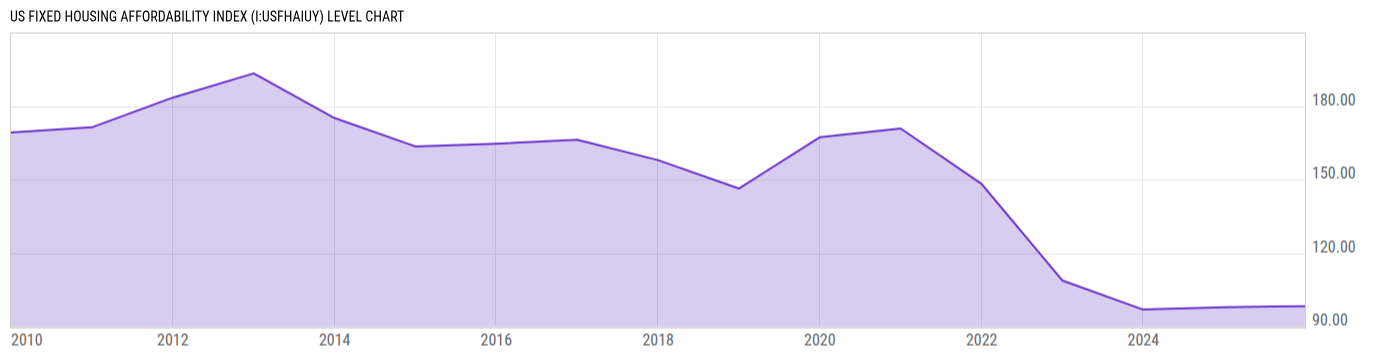
US Fixed Housing Affordability Index (I:USFHAIUY)
98.30 for 2025
Level Chart
Basic Info
|
US Fixed Housing Affordability Index is at a current level of 98.30, up from 97.90 one year ago. This is a change of 0.41% from one year ago. |
|
None |
| Report | Monthly Report on Housing Affordability |
| Category | House Prices |
| Region | United States |
| Source | National Association of Realtors |
Stats
| Last Value | 98.30 |
| Latest Period | 2025 |
| Last Updated | May 11 2026, 10:58 EDT |
| Next Release | Jun 9 2026, 10:00 EDT |
| Average Growth Rate | -2.87% |
| Value from 1 Year Ago | 97.90 |
| Change from 1 Year Ago | 0.41% |
| Frequency | Yearly |
| Adjustment | Not Seasonally Adjusted |
| Download Source File |
Historical Data
| Date | Value |
|---|---|
| December 31, 2025 | 98.30 |
| December 31, 2024 | 97.90 |
| December 31, 2023 | 96.90 |
| December 31, 2022 | 108.80 |
| December 31, 2021 | 148.20 |
| December 31, 2020 | 170.80 |
| December 31, 2019 | 167.20 |
| December 31, 2018 | 146.30 |
| December 31, 2017 | 157.90 |
| Date | Value |
|---|---|
| December 31, 2016 | 166.20 |
| December 31, 2015 | 164.60 |
| December 31, 2014 | 163.50 |
| December 31, 2013 | 175.10 |
| December 31, 2012 | 193.30 |
| December 31, 2011 | 183.40 |
| December 31, 2010 | 171.30 |
| December 31, 2009 | 169.20 |
News
Headline
Time (ET)
05/19 15:28
05/15 07:05
05/07 12:00
Basic Info
|
US Fixed Housing Affordability Index is at a current level of 98.30, up from 97.90 one year ago. This is a change of 0.41% from one year ago. |
|
None |
| Report | Monthly Report on Housing Affordability |
| Category | House Prices |
| Region | United States |
| Source | National Association of Realtors |
Stats
| Last Value | 98.30 |
| Latest Period | 2025 |
| Last Updated | May 11 2026, 10:58 EDT |
| Next Release | Jun 9 2026, 10:00 EDT |
| Average Growth Rate | -2.87% |
| Value from 1 Year Ago | 97.90 |
| Change from 1 Year Ago | 0.41% |
| Frequency | Yearly |
| Adjustment | Not Seasonally Adjusted |
| Download Source File |