

US Finished Petroleum Products Product Supplied (I:USFPPPS)
461.88M bbl for Feb 2026
Level Chart
Basic Info
|
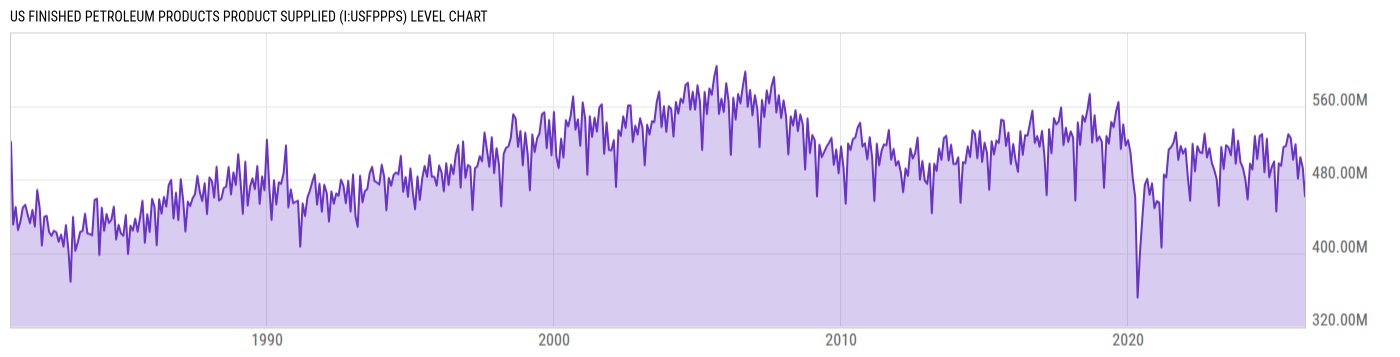
US Finished Petroleum Products Product Supplied is at a current level of 461.88M, down from 492.42M last month and up from 445.19M one year ago. This is a change of -6.20% from last month and 3.75% from one year ago. |
| Report | US Petroleum Product Supplied |
| Category | Energy |
| Region | United States |
| Source | Energy Information Administration |
Stats
| Last Value | 461.88M |
| Latest Period | Feb 2026 |
| Last Updated | Apr 30 2026, 15:35 EDT |
| Next Release | May 29 2026, 15:30 EDT |
| Average Growth Rate | 1.84% |
| Value from Last Month | 492.42M |
| Change from Last Month | -6.20% |
| Value from 1 Year Ago | 445.19M |
| Change from 1 Year Ago | 3.75% |
| Frequency | Monthly |
| Unit | Barrels |
| Adjustment | N/A |
| Download Source File |
Historical Data
| Date | Value |
|---|---|
| February 28, 2026 | 461.88M |
| January 31, 2026 | 492.42M |
| December 31, 2025 | 504.28M |
| November 30, 2025 | 480.99M |
| October 31, 2025 | 518.26M |
| September 30, 2025 | 501.62M |
| August 31, 2025 | 525.14M |
| July 31, 2025 | 529.33M |
| June 30, 2025 | 516.32M |
| May 31, 2025 | 515.54M |
| April 30, 2025 | 494.93M |
| March 31, 2025 | 497.60M |
| February 28, 2025 | 445.19M |
| January 31, 2025 | 499.55M |
| December 31, 2024 | 493.33M |
| November 30, 2024 | 482.53M |
| October 31, 2024 | 524.41M |
| September 30, 2024 | 487.99M |
| August 31, 2024 | 529.35M |
| July 31, 2024 | 527.20M |
| June 30, 2024 | 502.21M |
| May 31, 2024 | 527.40M |
| April 30, 2024 | 490.96M |
| March 31, 2024 | 497.28M |
| February 29, 2024 | 458.42M |
| Date | Value |
|---|---|
| January 31, 2024 | 480.07M |
| December 31, 2023 | 492.68M |
| November 30, 2023 | 498.96M |
| October 31, 2023 | 522.24M |
| September 30, 2023 | 497.21M |
| August 31, 2023 | 534.77M |
| July 31, 2023 | 506.35M |
| June 30, 2023 | 515.19M |
| May 31, 2023 | 517.31M |
| April 30, 2023 | 491.50M |
| March 31, 2023 | 515.48M |
| February 28, 2023 | 451.41M |
| January 31, 2023 | 480.60M |
| December 31, 2022 | 490.48M |
| November 30, 2022 | 498.04M |
| October 31, 2022 | 514.09M |
| September 30, 2022 | 503.99M |
| August 31, 2022 | 529.67M |
| July 31, 2022 | 508.66M |
| June 30, 2022 | 509.71M |
| May 31, 2022 | 516.27M |
| April 30, 2022 | 489.02M |
| March 31, 2022 | 518.89M |
| February 28, 2022 | 456.96M |
| January 31, 2022 | 480.80M |
News
Headline
Time (ET)
05/20 16:03
05/05 05:55
Basic Info
|
US Finished Petroleum Products Product Supplied is at a current level of 461.88M, down from 492.42M last month and up from 445.19M one year ago. This is a change of -6.20% from last month and 3.75% from one year ago. |
| Report | US Petroleum Product Supplied |
| Category | Energy |
| Region | United States |
| Source | Energy Information Administration |
Stats
| Last Value | 461.88M |
| Latest Period | Feb 2026 |
| Last Updated | Apr 30 2026, 15:35 EDT |
| Next Release | May 29 2026, 15:30 EDT |
| Average Growth Rate | 1.84% |
| Value from Last Month | 492.42M |
| Change from Last Month | -6.20% |
| Value from 1 Year Ago | 445.19M |
| Change from 1 Year Ago | 3.75% |
| Frequency | Monthly |
| Unit | Barrels |
| Adjustment | N/A |
| Download Source File |