

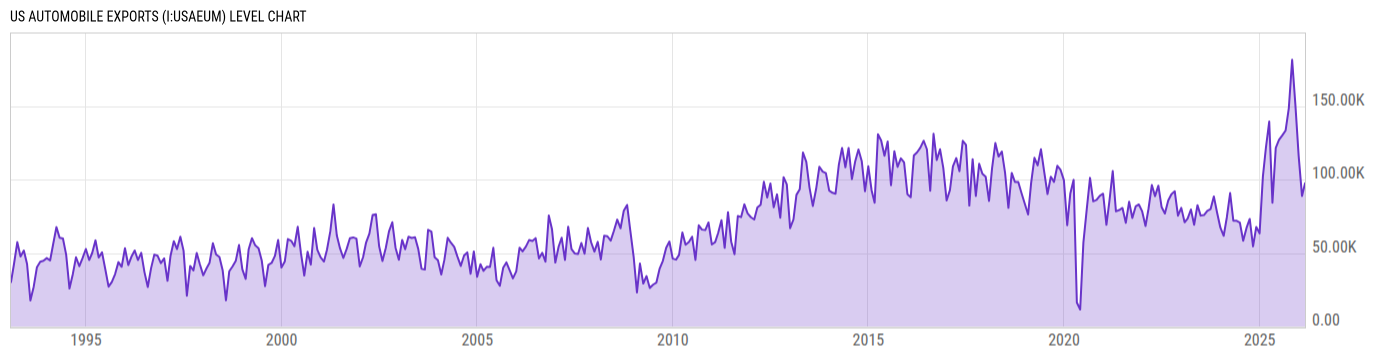
US Automobile Exports (I:USAEUM)
97.38K for Feb 2026
Level Chart
Basic Info
|
US Automobile Exports is at a current level of 97.38K, up from 88.81K last month and down from 121.61K one year ago. This is a change of 9.65% from last month and -19.93% from one year ago. |
| Report | Supplemental Estimates |
| Category | Retail and Services Business Statistics |
| Region | United States |
| Source | Bureau of Economic Analysis |
Stats
| Last Value | 97.38K |
| Latest Period | Feb 2026 |
| Last Updated | May 3 2026, 18:17 EDT |
| Next Release | May 28 2026, 10:00 EDT |
| Average Growth Rate | 43.81% |
| Value from Last Month | 88.81K |
| Change from Last Month | 9.65% |
| Value from 1 Year Ago | 121.61K |
| Change from 1 Year Ago | -19.93% |
| Frequency | Monthly |
| Adjustment | Not Seasonally Adjusted |
| Download Source File |
Historical Data
| Date | Value |
|---|---|
| February 28, 2026 | 97.38K |
| January 31, 2026 | 88.81K |
| December 31, 2025 | 115.90K |
| November 30, 2025 | 151.09K |
| October 31, 2025 | 181.46K |
| September 30, 2025 | 148.58K |
| August 31, 2025 | 133.38K |
| July 31, 2025 | 129.99K |
| June 30, 2025 | 126.90K |
| May 31, 2025 | 121.59K |
| April 30, 2025 | 84.24K |
| March 31, 2025 | 139.43K |
| February 28, 2025 | 121.61K |
| January 31, 2025 | 102.12K |
| December 31, 2024 | 63.35K |
| November 30, 2024 | 67.75K |
| October 31, 2024 | 54.51K |
| September 30, 2024 | 73.19K |
| August 31, 2024 | 67.04K |
| July 31, 2024 | 58.33K |
| June 30, 2024 | 70.69K |
| May 31, 2024 | 71.90K |
| April 30, 2024 | 71.99K |
| March 31, 2024 | 90.80K |
| February 29, 2024 | 74.16K |
| Date | Value |
|---|---|
| January 31, 2024 | 61.73K |
| December 31, 2023 | 67.20K |
| November 30, 2023 | 77.52K |
| October 31, 2023 | 88.50K |
| September 30, 2023 | 79.82K |
| August 31, 2023 | 78.61K |
| July 31, 2023 | 75.80K |
| June 30, 2023 | 75.42K |
| May 31, 2023 | 82.55K |
| April 30, 2023 | 69.20K |
| March 31, 2023 | 79.59K |
| February 28, 2023 | 73.37K |
| January 31, 2023 | 70.86K |
| December 31, 2022 | 80.69K |
| November 30, 2022 | 75.37K |
| October 31, 2022 | 92.00K |
| September 30, 2022 | 90.01K |
| August 31, 2022 | 85.72K |
| July 31, 2022 | 76.85K |
| June 30, 2022 | 81.32K |
| May 31, 2022 | 95.81K |
| April 30, 2022 | 88.67K |
| March 31, 2022 | 96.20K |
| February 28, 2022 | 80.09K |
| January 31, 2022 | 68.30K |
News
Headline
Time (ET)
05/12 07:21
04/24 07:42
04/23 08:36
Basic Info
|
US Automobile Exports is at a current level of 97.38K, up from 88.81K last month and down from 121.61K one year ago. This is a change of 9.65% from last month and -19.93% from one year ago. |
| Report | Supplemental Estimates |
| Category | Retail and Services Business Statistics |
| Region | United States |
| Source | Bureau of Economic Analysis |
Stats
| Last Value | 97.38K |
| Latest Period | Feb 2026 |
| Last Updated | May 3 2026, 18:17 EDT |
| Next Release | May 28 2026, 10:00 EDT |
| Average Growth Rate | 43.81% |
| Value from Last Month | 88.81K |
| Change from Last Month | 9.65% |
| Value from 1 Year Ago | 121.61K |
| Change from 1 Year Ago | -19.93% |
| Frequency | Monthly |
| Adjustment | Not Seasonally Adjusted |
| Download Source File |