

US Existing Single-Family Home Sales (I:USESFHUM)
320000.0 for Apr 2026
Level Chart
Basic Info
|
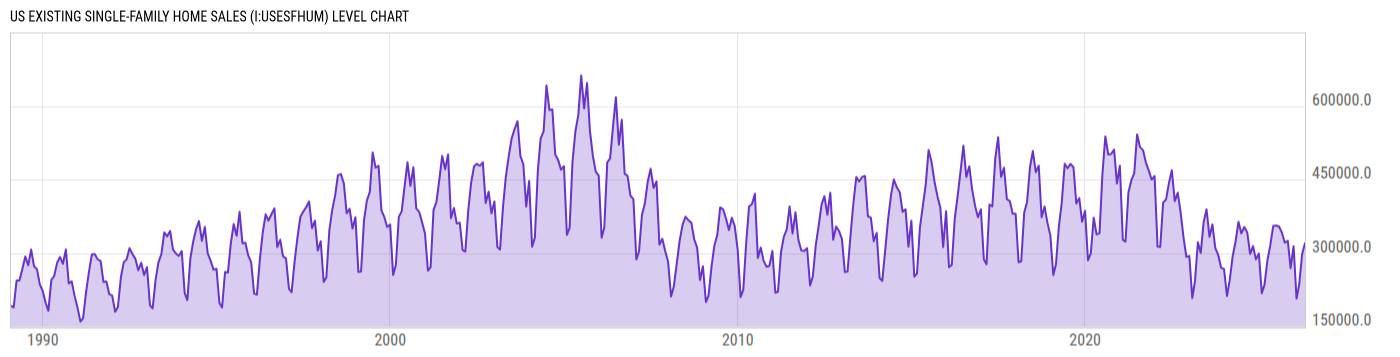
US Existing Single-Family Home Sales is at a current level of 320000.0, up from 298000.0 last month and up from 316000.0 one year ago. This is a change of 7.38% from last month and 1.27% from one year ago. |
| Report | Existing-Home Sales |
| Category | House Sales |
| Region | United States |
| Source | National Association of Realtors |
Stats
| Last Value | 320000.0 |
| Latest Period | Apr 2026 |
| Last Updated | May 14 2026, 12:10 EDT |
| Next Release | Jun 9 2026, 10:00 EDT |
| Average Growth Rate | 15.33% |
| Value from Last Month | 298000.0 |
| Change from Last Month | 7.38% |
| Value from 1 Year Ago | 316000.0 |
| Change from 1 Year Ago | 1.27% |
| Frequency | Monthly |
| Adjustment | Not Seasonally Adjusted |
| Download Source File |
Historical Data
| Date | Value |
|---|---|
| April 30, 2026 | 320000.0 |
| March 31, 2026 | 298000.0 |
| February 28, 2026 | 236000.0 |
| January 31, 2026 | 207000.0 |
| December 31, 2025 | 314000.0 |
| November 30, 2025 | 269000.0 |
| October 31, 2025 | 325000.0 |
| September 30, 2025 | 321000.0 |
| August 31, 2025 | 341000.0 |
| July 31, 2025 | 354000.0 |
| June 30, 2025 | 356000.0 |
| May 31, 2025 | 355000.0 |
| April 30, 2025 | 316000.0 |
| March 31, 2025 | 285000.0 |
| February 28, 2025 | 235000.0 |
| January 31, 2025 | 218000.0 |
| December 31, 2024 | 299000.0 |
| November 30, 2024 | 287000.0 |
| October 31, 2024 | 314000.0 |
| September 30, 2024 | 298000.0 |
| August 31, 2024 | 342000.0 |
| July 31, 2024 | 353000.0 |
| June 30, 2024 | 340000.0 |
| May 31, 2024 | 364000.0 |
| April 30, 2024 | 323000.0 |
| Date | Value |
|---|---|
| March 31, 2024 | 294000.0 |
| February 29, 2024 | 245000.0 |
| January 31, 2024 | 212000.0 |
| December 31, 2023 | 267000.0 |
| November 30, 2023 | 270000.0 |
| October 31, 2023 | 296000.0 |
| September 30, 2023 | 310000.0 |
| August 31, 2023 | 358000.0 |
| July 31, 2023 | 333000.0 |
| June 30, 2023 | 389000.0 |
| May 31, 2023 | 364000.0 |
| April 30, 2023 | 300000.0 |
| March 31, 2023 | 322000.0 |
| February 28, 2023 | 242000.0 |
| January 31, 2023 | 208000.0 |
| December 31, 2022 | 294000.0 |
| November 30, 2022 | 292000.0 |
| October 31, 2022 | 332000.0 |
| September 30, 2022 | 384000.0 |
| August 31, 2022 | 423000.0 |
| July 31, 2022 | 406000.0 |
| June 30, 2022 | 469000.0 |
| May 31, 2022 | 443000.0 |
| April 30, 2022 | 409000.0 |
| March 31, 2022 | 403000.0 |
News
Headline
Time (ET)
05/15 07:05
Home Sales Activity in Canada Seen "Low" in Key Spring Season Despite April Lift, Says National Bank
05/14 11:37
05/14 11:11
05/14 07:24
Basic Info
|
US Existing Single-Family Home Sales is at a current level of 320000.0, up from 298000.0 last month and up from 316000.0 one year ago. This is a change of 7.38% from last month and 1.27% from one year ago. |
| Report | Existing-Home Sales |
| Category | House Sales |
| Region | United States |
| Source | National Association of Realtors |
Stats
| Last Value | 320000.0 |
| Latest Period | Apr 2026 |
| Last Updated | May 14 2026, 12:10 EDT |
| Next Release | Jun 9 2026, 10:00 EDT |
| Average Growth Rate | 15.33% |
| Value from Last Month | 298000.0 |
| Change from Last Month | 7.38% |
| Value from 1 Year Ago | 316000.0 |
| Change from 1 Year Ago | 1.27% |
| Frequency | Monthly |
| Adjustment | Not Seasonally Adjusted |
| Download Source File |